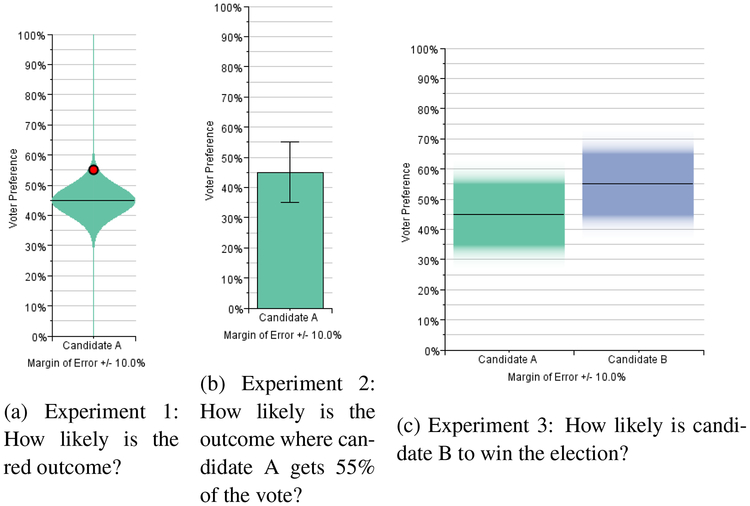
Fig. 3.
Example stimuli from our experiments. Each presents tasks which are similar in concept, but deal with different aspects of the visual presentation of statistical inference. The graphs are presented as violin plots, bar charts with error bars, and gradient plots, respectively, but all experiments tested multiple graph types.

