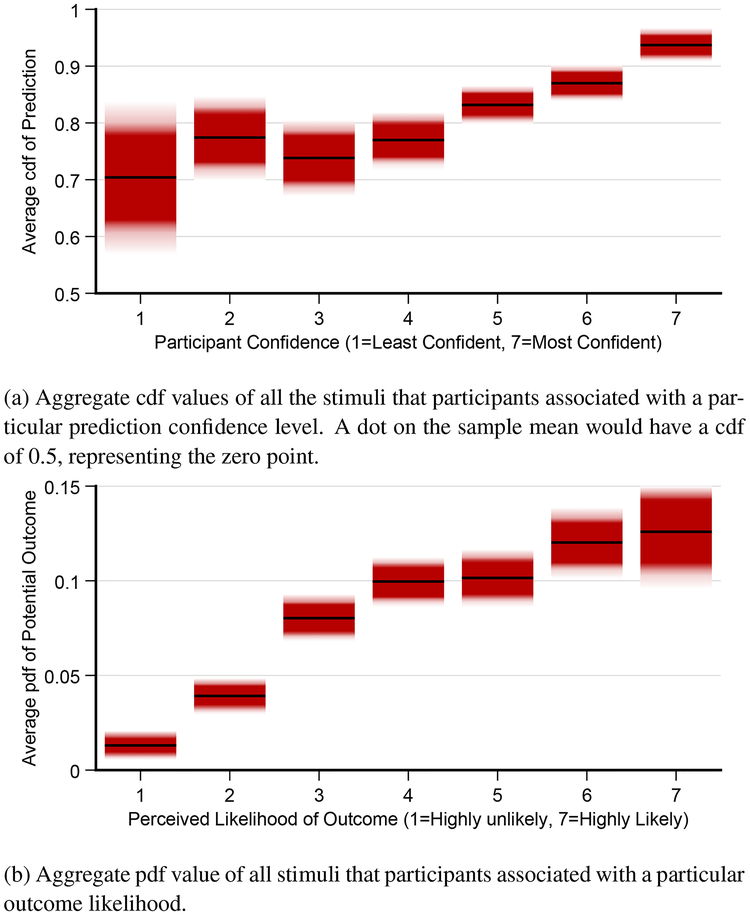
Fig. 4.
Gradient plots of our results from the one-sample judgments experiment (§4.2). Participants were shown a sample mean with error, and a red dot representing a proposed outcome. They were asked to predict whether or not the population outcome was likely to be lower or higher than the red dot, and then asked for their confidence in this prediction. This response is analogous to a question about the cdf of the t-distribution (4a). They were also asked how likely the red dot was, given the sample mean. This response is analogous to a question about the pdf of the t-distribution (4b).

