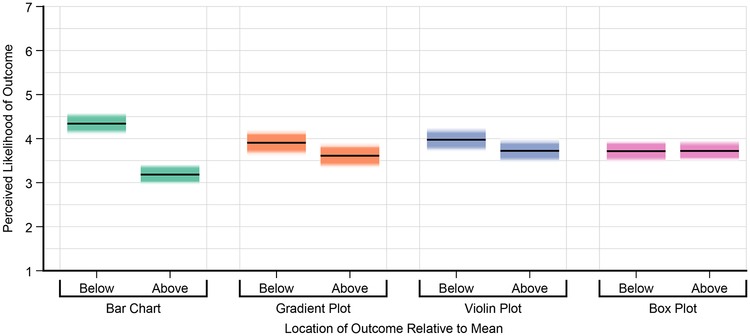
Fig. 5.
A gradient plot of results from our one-sample judgments experiment (§4.2). Participants were shown a red dot representing a potential outcome and judged how likely this outcome was given the sample mean and the margin of error. Statistical expectation is that likelihood would be symmetric about the mean — that is, red dots above the sample mean would be perceived as just as likely as those below the mean. For bar charts this is not the case — points visually contained by the glyph of the bar (below the sample mean)were seen as likelier than those not contained by the bar. Visually symmetric encodings mitigate this issue.

