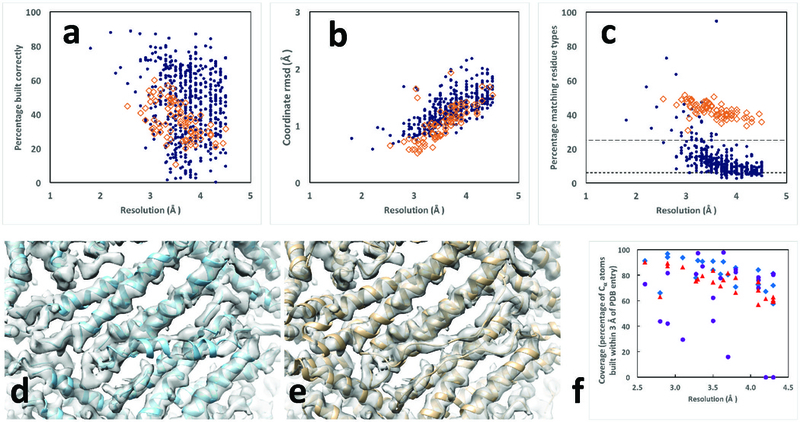
Fig. 2.

Residues in deposited models reproduced by automated analysis of cryo-EM reconstructions. Protein chains are indicated by blue dots and RNA chains are indicated by open brown diamonds. Residues are considered matched if Cα atom or P atom coordinates match within 3 Å (see Methods). Rms coordinate differences are assessed for all matched residues. A. Fraction of residues in deposited structure reproduced by automated analysis. Blue dots are protein chains and orange squares are RNA chains in panels A-C. B. Rms coordinate differences between matched residues in deposited structure and automated analysis. C. Fraction of residues in automated analysis matching a residue in the deposited model that also share the residue type of the matching residue in the deposited structure. The expected fraction matching based on random sequence assignment is roughly 6% for protein with 20 amino acids with frequencies in eukaryotes and roughly 25% for RNA with 4 bases and similar frequencies, illustrated by the horizontal lines in Fig. 2C. D and E, automatically generated and deposited models of horse spleen apoferritin (EMDB entry 2788 and PDB entry 4v1w). F. Comparison of fraction of deposited models reproduced by MAINMAST (blue diamonds), de novo Rosetta modeling (purple circles), and using the automated procedure described here (red triangles), all based on maps cut out from deposited maps based on a single chain of the deposited model as described8. Graphics created with Chimera22.
