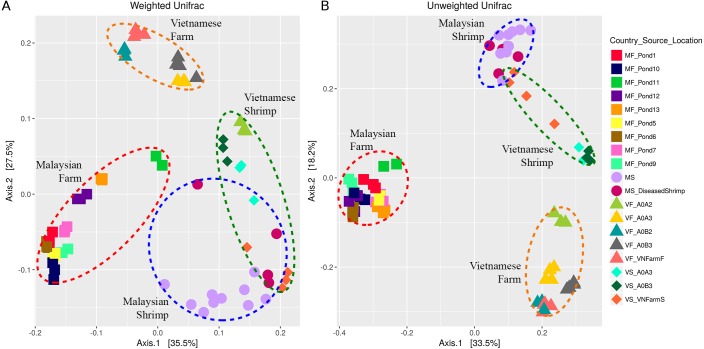
Figure 3. Principal component analysis of (A) weighted Unifrac and (B) unweighted Unifrac distances.
Red circular outline shows ‘Malaysian pond’ cluster, yellow circular outline shows ‘Vietnamese pond’ cluster, blue circular outline marks ‘Malaysian shrimp’ cluster, and green circular outline represents ‘Vietnamese shrimp sample. The sample points were coloured according to “Country_Source_Location” information (Table S1). Country and source information of each points were abbreviated; for example, Malaysian farm sample from Pond 1 was labelled as MF_Pond1.

