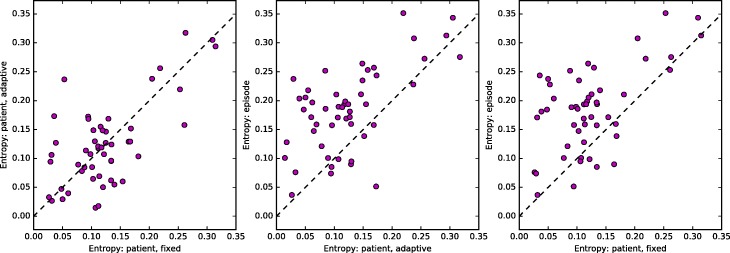
Fig. 3.
Mean entropy for each HRR, computed over six 1-year windows, using each of the three different ways to construct the network: fixed-threshold, adaptive-threshold, and episode-based. Each panel shows a scatter plot of two of the three entropy measures plotted against one another: fixed-threshold vs. adaptive-threshold (left), adaptive-threshold vs. episode-based (middle), and fixed-patient vs. episode-based (right). The Pearson correlation coefficients and their p-values for testing the hypothesis of no correlation are 0.66 (p=1.159e-07), 0.61 (p=1.804e-06), and 0.58 (p=6.925e-06), respectively

