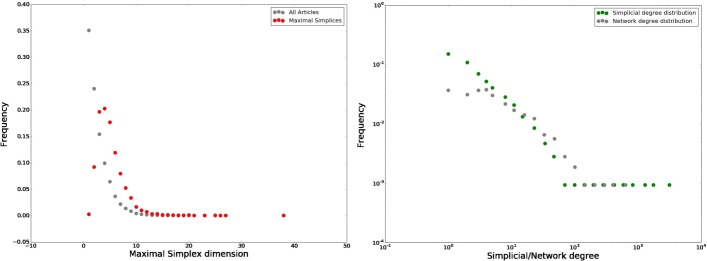
Fig. 1.
Dimension of maximal simplices and simplicial degree. On the lefthand side the distribution of number of concepts per article. Here we compare the distribution of the entire dataset (grey) with that of the papers included in the simplicial complex, which shows that most of the articles with few concepts in are not included as they are a subset of other articles. On the righthand side the simplicial and network degree distribution are showed

