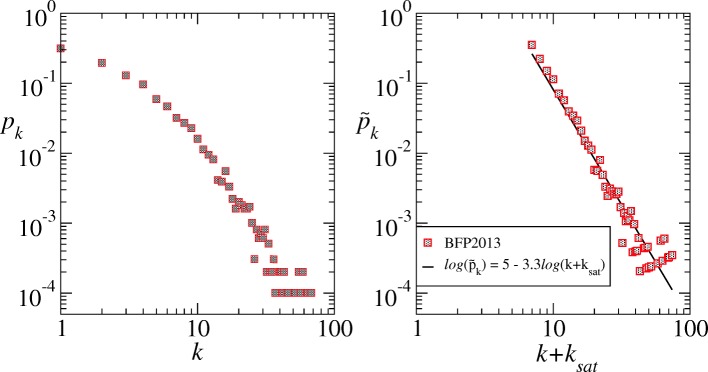
Fig. 3.
Degree distribution pk for the federal criminal intelligence network in log-log axis, showing the typical real networks features of low degree saturation and high degree cutoff (left panel). Re-scaled degree function as a function of in log-log scale and the power-law fit (right panel). The linear fit is such that with adjusted R2 of 0.937 and KS p-value 0.8693, meaning the model explains the data variability and that the null hypothesis is most probable. To reach this statistics we have proceeded according to the recipe for analyzing power-law distributed data proposed by Clauset et al. (2009). That is, we have proceeded a linear regression with the method of maximum likelihood in the log-transformed data to estimate the power-law parameters. The resulting statistics gives a very high p-value (0.8693) meaning the generalized power-law is a highly plausible hypothesis for the data. We then compared the result with a log-normal distribution (p-value 0.5441) via likelihood ratio test which resulted positive indicating that the generalized power-law model is favored over the log-normal. Simple power-law and exponential functions also do not show significant results

