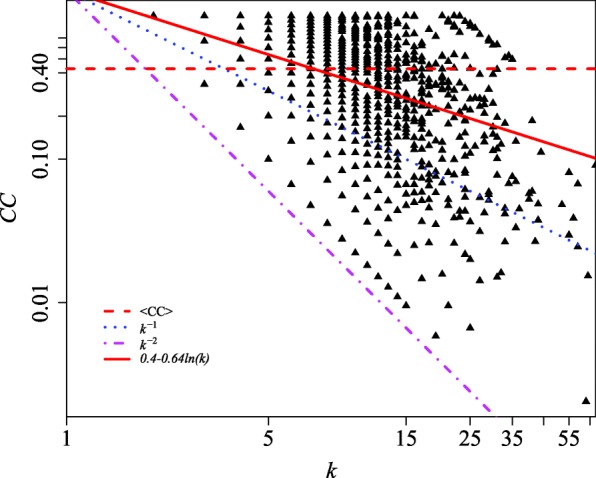
Fig. 4.

Clustering coefficient (CC) as a function of the degree (k) in log-log representation. The horizontal dashed red line is the average clustering coefficient (<CC>∼0.43). The dotted blue line is CC∼k−1, the dotdashed magenta line stands for CC∼k−2 and the solid red line is the linear fit ln(CC)=(0.40195±0.02096)−(0.63820±0.01287)×ln(k) with adjusted R2 of 0.2923 and very small p-value, meaning that the model explains only a few of the variability of the data around its average
