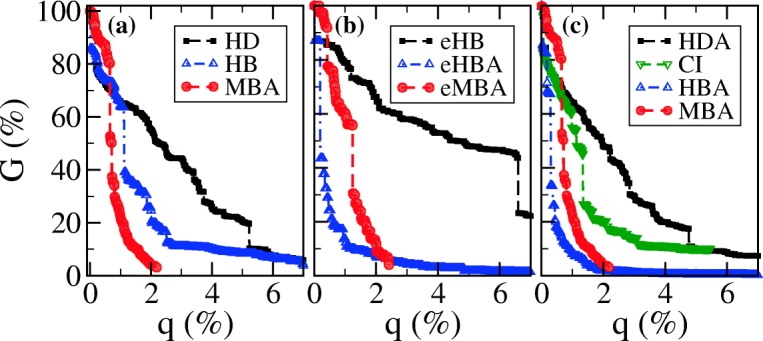
Fig. 5.

Fragmentation results of the federal criminal intelligence network represented by the relative size of the largest connected component, G, as a function of the percentage of nodes/edges removed, q, according to procedures based on different measurements: a, node removal by Degree (HD - black squares), Betweenness (HB - blue triangles), and Modular (MBA - red circles); b, edge removal by Betweenness (eHB - black squares), Betweenness Adaptive (eHBA - blue triangles), and Modular (eMBA - red circles); c, node removal by Degree Adaptive (HDA - black squares), Collective Influence (CI - lower green triangles), Betweenness Adaptive (HBA - blue triangles), and Modular (MBA - red circles)
