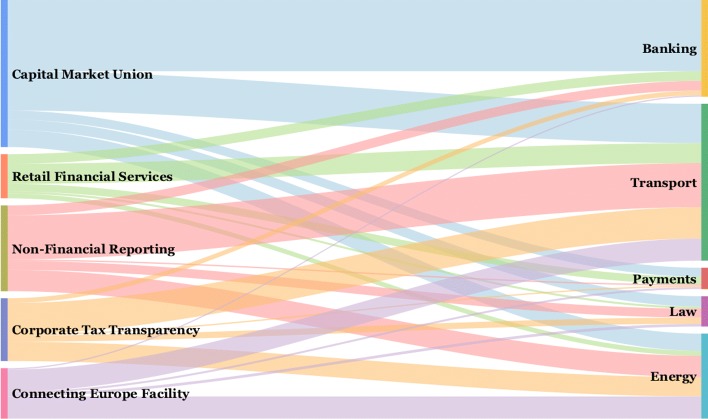
Fig. 4.
Relations between the topic communities and tag clouds. The Sankey diagram links the detected topic communities (left-hand side) to the clusters of the self-described goals and activities (right-hand side). We observe no significant correspondence between the topic communities and clusters, also confirmed by quantitative measures

