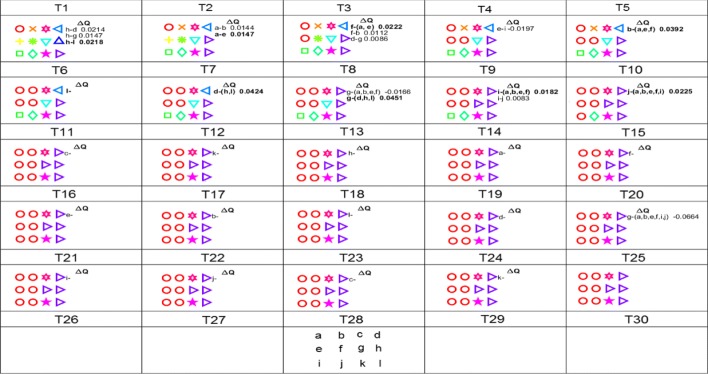
Fig. 4.
Illustration of Voronoi-connected community clique detection for a coherence network with the coherence matrix shown in Table 1. Each colored symbol represents a community at T1. For each step Ti, the gain ΔQ is shown on the right. Before the dash: the node to be removed; after the dash: the node or nodes constituting a community. T28 shows the vertex positions in 2D space

