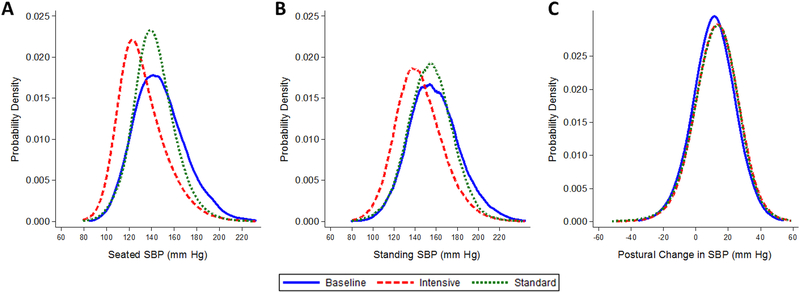
Figure 1.
Kernel density plots of the distributions of (A) seated systolic blood pressure (mm Hg), (B) standing systolic blood pressure, and (C) postural change between standing and seated systolic blood pressure (mm Hg) at baseline (i.e. pre-randomization) (solid line) and during follow-up in participants assigned the intensive blood pressure goal (mean arterial pressure or MAP ≤92 mm Hg) (dash line) and in participants assigned the standard BP goal (MAP between 102–107 mm Hg) (dotted line). There were 3,946 baseline visits, 24,844 post-randomization visits among participants assigned the intensive BP goal, and 24,074 post-randomization visits among participants assigned the standard BP goal.

