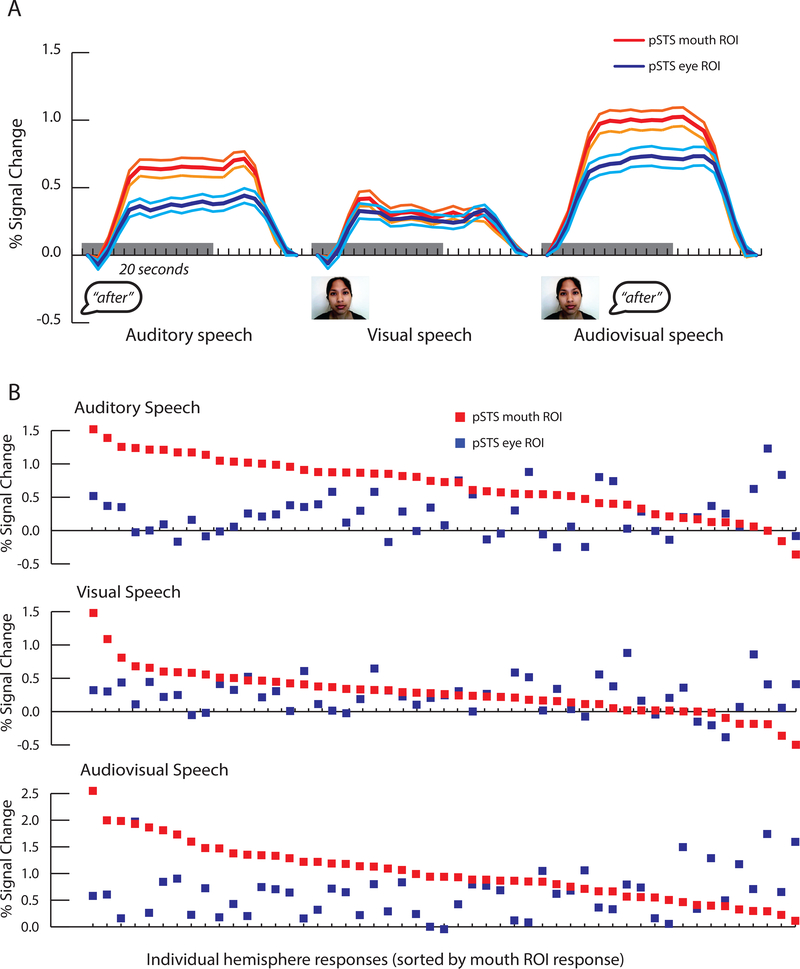
Figure 3:
Responses to blocks of speech in the second fMRI experiment. This data was analyzed independently from the eye tracking data used to define the ROIs in the first fMRI experiment. A. Time course of the average BOLD fMRI response to blocks of auditory, visual and audiovisual speech in the pSTS mouth (red traces) and eye ROIs (blue traces). Center lines show mean, flanking lines show SEM. Gray bar indicates 20-second stimulus duration. B. Response amplitudes within individual participants to blocks of auditory, visual and audiovisual speech. Each participant is represented by a vertical dot pair, where the red dot represents the response in the mouth ROI and the blue dot represents the response in the eye ROI (participants sorted by decreasing amplitude of mouth ROI response).

