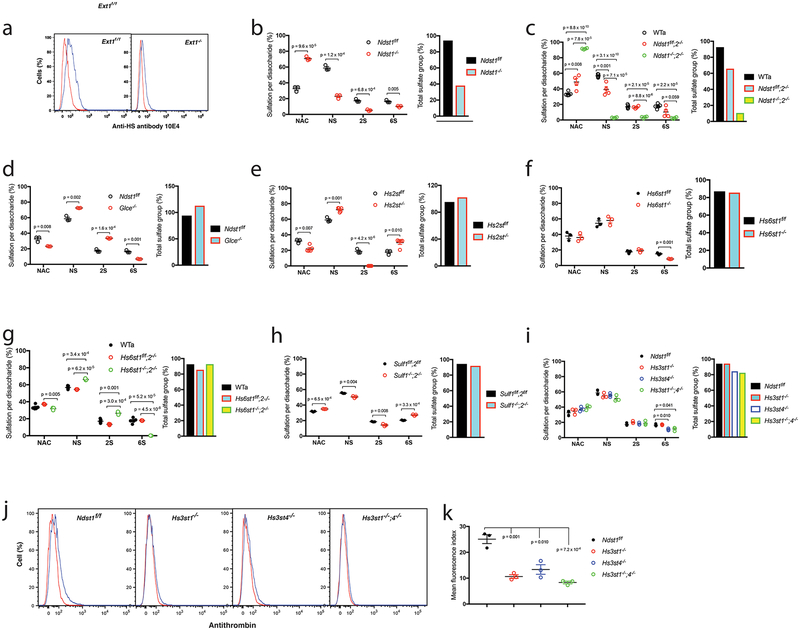
Figure 2. HS expression in the generated mutant MLEC lines.
a. Cell surface anti-HS antibody 10E4 binding was analyzed by flow cytometry. b-i. HS disaccharide composition analysis. HS isolated from mutant MLECs and their controls were digested with heparinases I-III, and the resulting disaccharides were separated by HPLC and quantified. The same type sulfate groups, including NS, 2S and 6S, of the separated disaccharides were combined to assess the levels of each sulfation modification type. The data were summarized from 3 independent experiments and are presented as mean ± SEM. WTa, the wildtype control data were summarized from similarly generated 5 wildtype MLEC lines (Ext1f/f, Ndst1f/f, Hs2stf/f, Hs6st1f/f and Sulf1f/f;2f/f); The total sulfate groups were calculated by adding up NS, 2S and 6S. j, k. Cell surface antithrombin binding. The wildtype control (Ndst1f/f) and Hs3st mutant MLECs were stained with biotinylated antithrombin and cell surface bound antithrombin was quantified by flow cytometry after further staining the cells with fluorescein-tagged streptavidin. The representative histograms from 3 independent experiments are shown (j). The quantitation of mean fluorescence index data were summarized from 3 independent experiments and are presented as mean ± SD (k). Statistical analyses were performed using two-sided, Student`s t-test.

