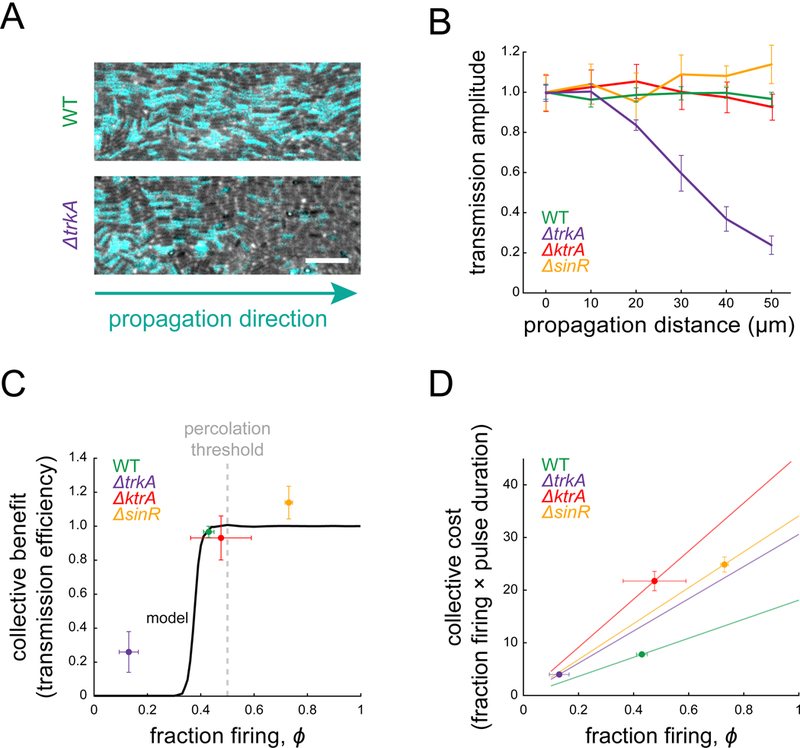
Figure 5. Signal transmission occurs above the percolation threshold.

(A) Phase images with overlaid ThT intensity (cyan) during peak signaling show steady propagation in wild-type (top) and spatial signal decay in ΔtrkA (bottom). Scale bar, 10 μm. (B) Transmission amplitude measurements show that wild-type (N = 7), ΔktrA (N =4), and ΔsinR (N = 4) propagate the signal at a constant amplitude, while ΔtrkA (N = 5) does not. Transmission amplitude is defined as the fraction of firing cells at a given position divided by the firing fraction at the beginning of the field of view (error bars, ± SEM). (C) Collective benefit of signaling is defined as the ratio of transmission amplitudes at the biofilm edge and at the beginning of the field of view. Experimental data are shown by points. The model output for wild-type parameters (black curve) illustrates the non-linear nature of collective benefit. (D) Collective cost of signaling is defined as the product of the firing cell fraction, ϕ, and mean pulse time. Experimental data are shown as points. Lines represent the cost that would be incurred for each strain given its mean pulse time.
