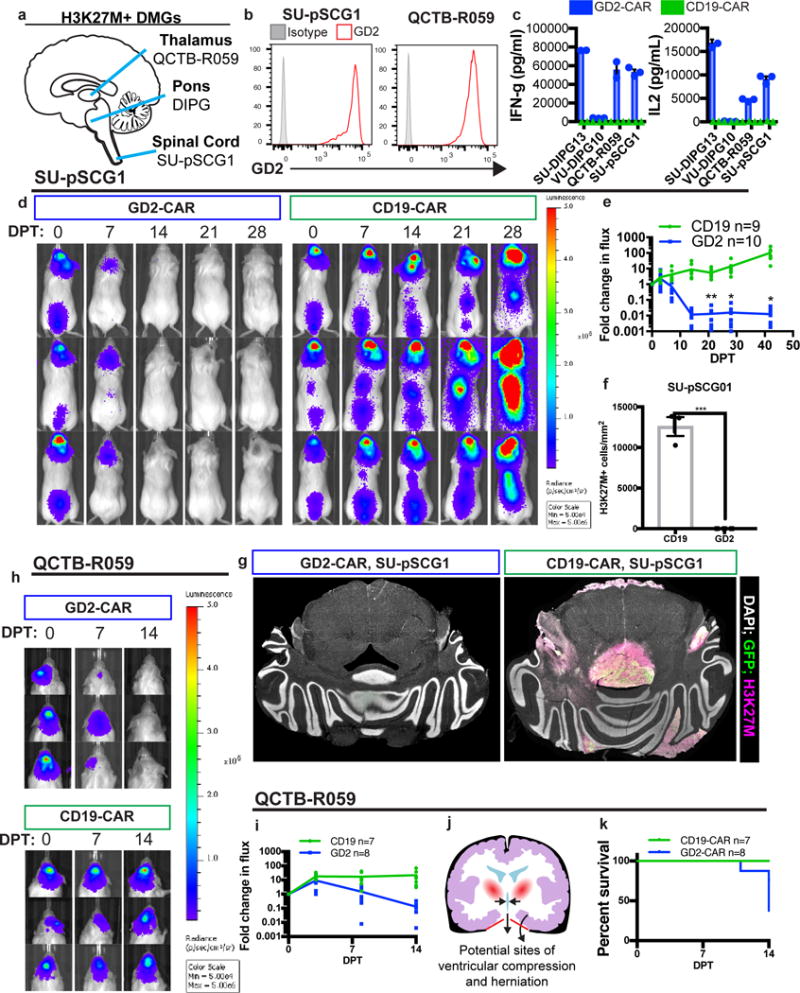
Figure 4. GD2 CAR T-cell therapy effectively clears other midline H3K27M mutant pediatric diffuse midline gliomas but is associated with toxicity in thalamic xenografts.

(a) Anatomic sites of origin of H3K27M+ DMGs. (b,c)Patient-derived culture models of H3K27M mutant tumors that arose in the thalamus (QCTB-R059) and spinal cord (SU-pSCG1) highly and uniformly express GD2 as assessed by flow cytometry (b) and induce antigen-dependent secretion of IFNγ and IL-2 when incubated with GD2 or CD19-CAR T-cells in vitro (c). (d,e) SU-pSCG1 cells stably transduced to express GFP and luciferase were engrafted into the medulla of NSG mice and treated with intravenous infusion of 1×10⁷ GD2-CAR T-cells (n=10) or CD19-CAR T-cells (n=9), and substantial clearance of engrafted tumor was observed by DPT14. Each row represents one mouse over time. (f) Quantification of H3K27M+ cells remaining in SU-pSCG1 xenografts at study endpoint revealed near complete clearance of engrafted tumor in GD2-CAR T-cell treated (n=3) animals compared to CD19-CAR T-cell controls (n=3). (g) Tiled immunofluorescence images across affected regions (GFP = green; H3K27M = red, DAPI = white). (h–i) The H3K27M mutant patient-derived cell culture QCTB-R059 was orthotopically engrafted into the thalamus of NSG mice and treated by systemic administration of GD2 or CD19-CAR T-cells as described for SU-pSCG1. Tumor burden over time as determined by bioluminescence imaging illustrates marked reduction by DPT 14, and histological clearance in surviving animals at DPT 30 (Supplementary Figure 10). (j) Diagram showing the risk for 3rd ventricular compression and herniation through the tentorium cerebelli (red) accompanying inflammation in the thalamus. (k) GD2-CAR T-cell therapy-associated deaths in mice with thalamic xenografts observed by DPT14 highlight the hazards of immunotherapy for midline tumors. Data as shown are mean±SEM. ***p<0.001, *p<0.05 by unpaired 2-tailed Student’s t-test with Holm-Sidak correction for multiple comparisons, n=3 independent samples for in vitro cytokine experiments. Experiments in (b,c,e,f,g) were performed twice.
