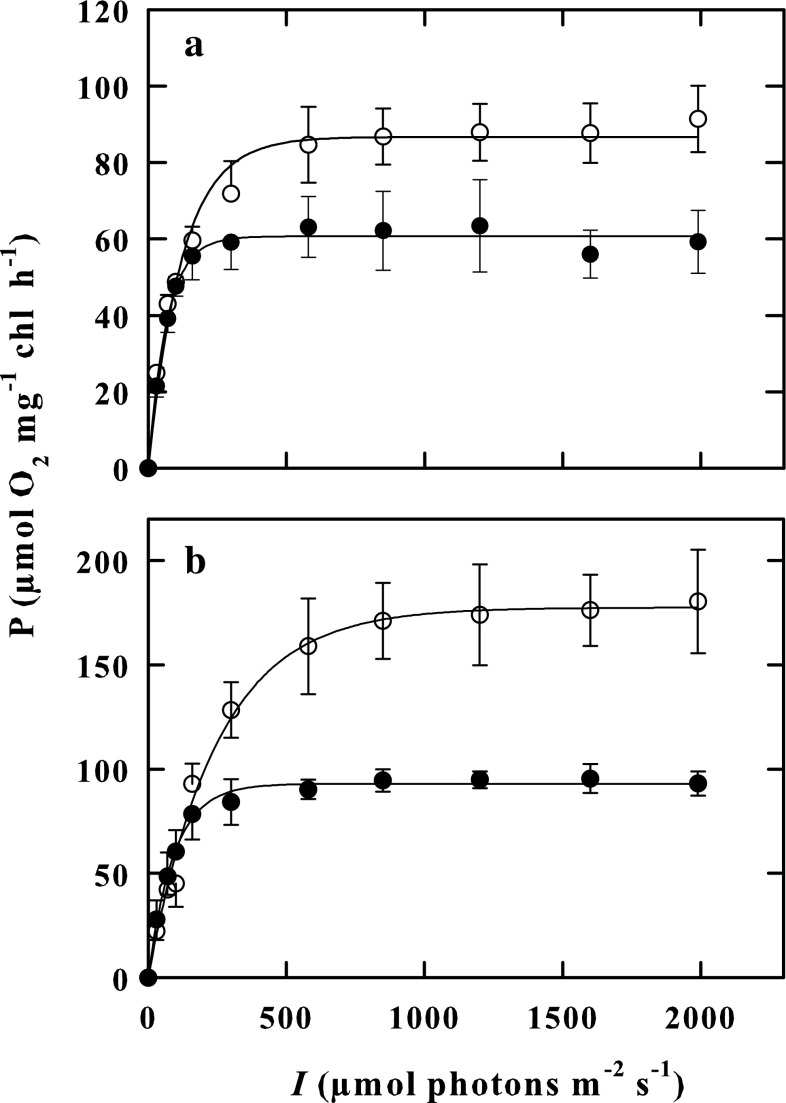
Fig. 2.
PB–I curves as measured at 15 °C (a) and 25 °C (b) in indoor-cultured cells (Black circle) and in outdoor-cultured cells (empty circle) of K. antarctica in the photon flux density range of 30–2000 μmol photons m−2 s−1. Vertical bars show ± SE (when larger than the symbol); n = 3. Data are means of different experiments

