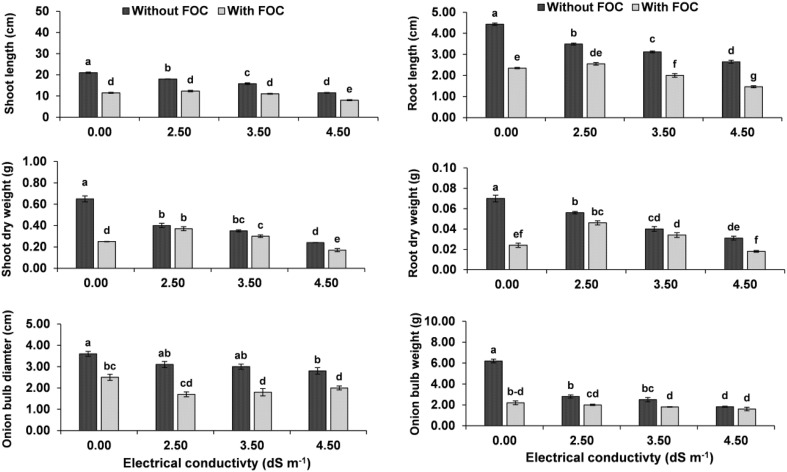
Fig. 3.
a–f Effect of F. oxysporum f. sp. cepa (FOC) and different salinity levels on growth and biomass in A. cepa at 50th day of inoculation. Values with different letters show significant difference (P ≤ 0.05) as determined by Tukey’s HSD Test. Vertical bars show standard errors of means of three replicates

