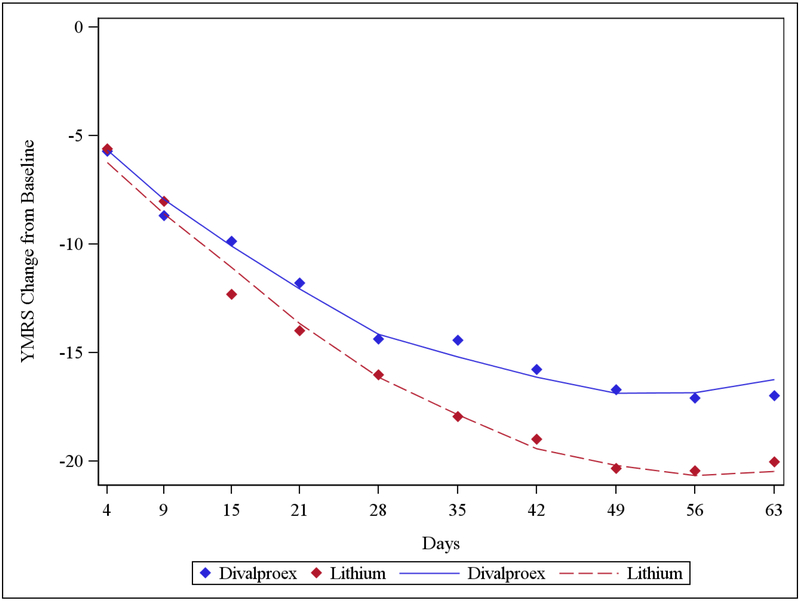
Figure 2. YMRS Change from Baseline.
Solid blue line and dashed red line show the Least Square Means (from mixed models) of YMRS Change from Day 0 for Divalproex and Lithium respectively. Blue and red diamonds represent average YMRS Change from Day 0 at different time points for Divalproex and Lithium respectively.

