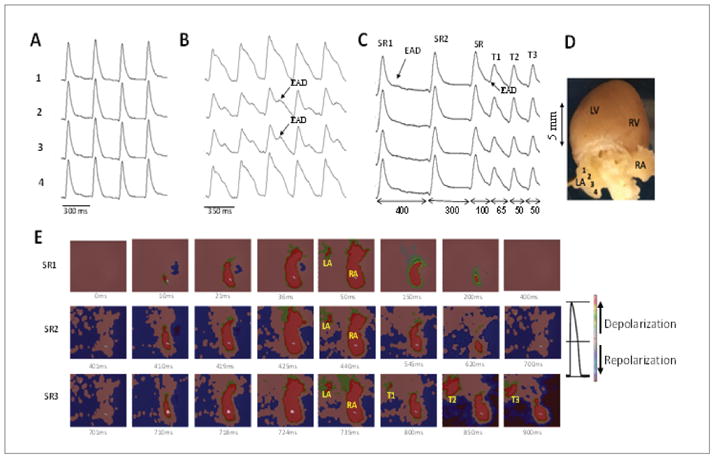
Figure 4.

Optical APs (OAPs) and voltage snapshots of epicardial LA and RA activation during sinus rhythm and at the onset of oxidative AF in an aged rat heart. Panel A shows four rows of OAPs recorded from the LA epicardial surface from sites shown in panel D during perfusion with normal Tyrode’s. Panel B shows the influence of 8 min of perfusion with H2O2 (0.1 mM) on these OAPs with the emergence of subthreshold EADs. Panel C shows the last three sinus beats just before the onset of EAD-mediated triggered activity (T1–T3). Note that the EAD amplitude during the sinus beat#1 and #2 manifest subthreshold EAD (arrows). However, the 3rd sinus beat initiates triggered activity (T1–T3). Double-headed arrows indicate the CL of the specified intervals. Panel E shows the snap shots of the six beats SR1, SR2, SR3, T1, T2, and T3, with the origination of the sinus beats from the RA and triggered beats arising from the LA. Adjoining the maps is a color bar showing depolarization and repolarization respectively.
