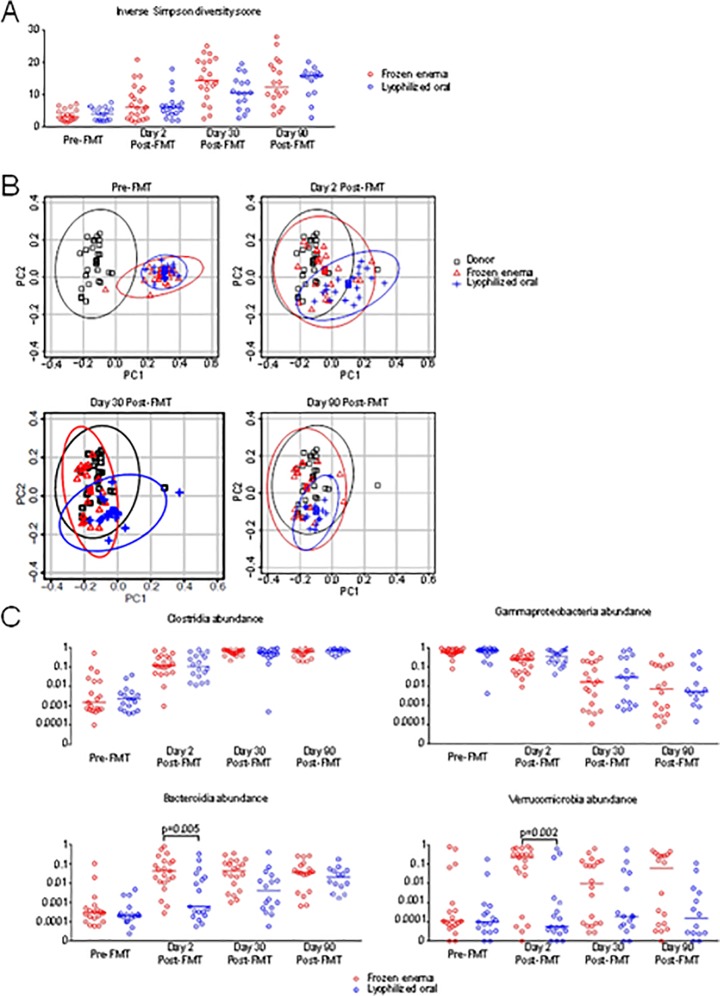
Fig 2. Microbiota analysis of 39 subjects before and after receiving FMT.
A) Microbial diversity, quantified by the inverse Simpson index which combines measures of richness and evenness, of subject samples collected pre-FMT and post-FMT on the indicated time points. B) Principal Coordinate Analysis (PCoA) of UniFrac distances at specified time points, as well as donor samples. The axis PC1 explains 20.03% variation of the data and PC2 explains 6.13% variation of the data. Ellipses depict 95% confidence regions for each group. C) Bacterial abundance at the Class level of taxonomy of subject samples at indicated time points.

