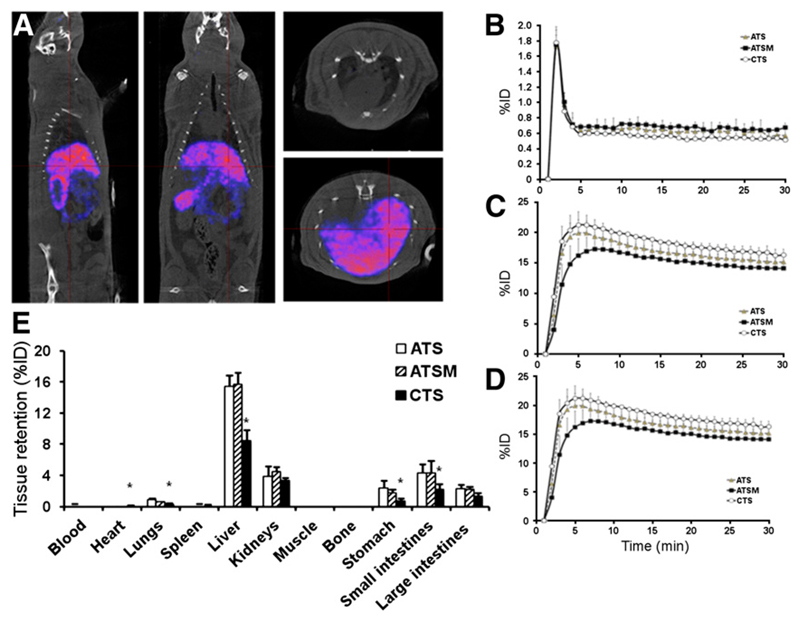
Figure 7.
(A) PET/CT images of healthy rat 30 min after injection with 64Cu-CTS (5 MBq in 200 μL). (B–D) Time-activity curves showing tracer pharmacokinetics of 64Cu-ATS, 64Cu-ATSM, and 64Cu-CTS in heart, liver, and kidneys, respectively. (E) Tissue biodistribution of each tracer 90 min after injection. Data are mean (n = 3) ± SD. Asterisk indicates significant difference from 64Cu-ATSM (P < 0.05).

