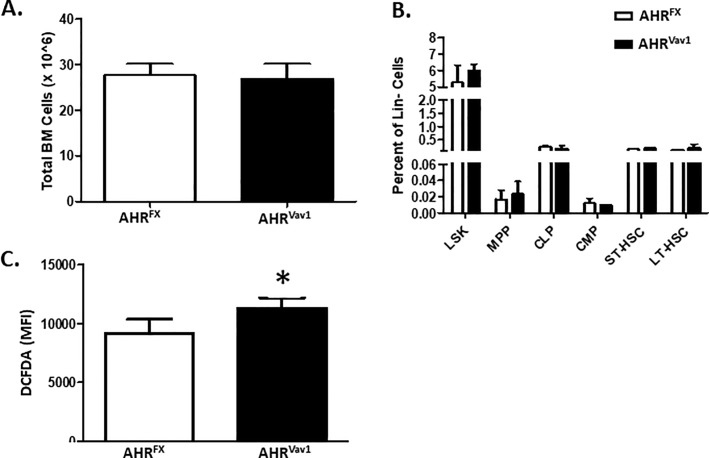
Fig 3. 8-week old AHRVav1 animals do not display alterations in total bone marrow cell counts or subpopulations and display heightened levels of ROS in hematopoietic LSK cells.
(A). Total BM counts were determined for both AHRVav1 and AHRFX animals. (B) Flow cytometry was used to determine percentage of various hematopoietic subpopulations. N = at least 5 mice per group. (C) Flow cyometry was used to identify LSK cells, which had been co-stained with DCFDA to determine levels of oxidative species. Data presented as mean ± S.D. n = 5 per group. * Values significantly different from control (p<0.05).

