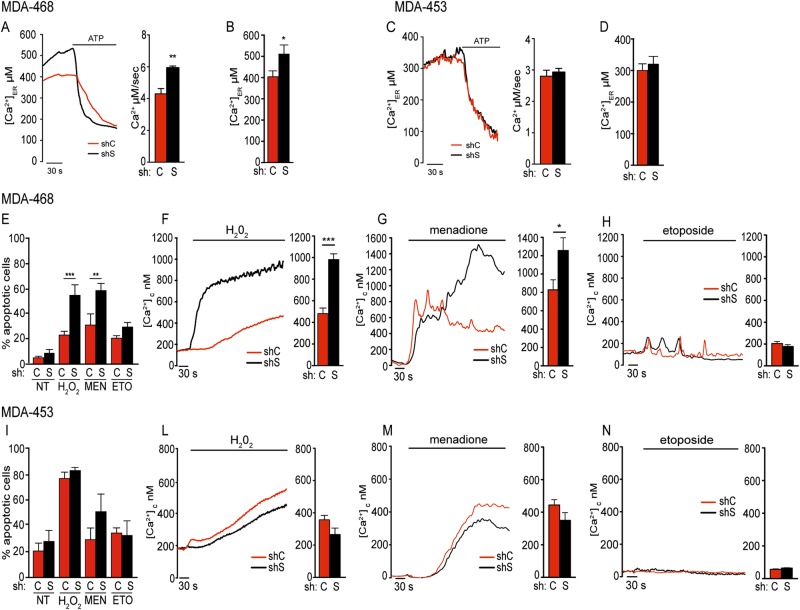
Fig. 1.
Relevance of STAT3 in Ca2+ homeostasis and apoptotic response. MDA-MB-468 (a, b, e–h) or MDA-MB-453 cells (c, d, i–n), silenced or not for STAT3 (shS, shSTAT3; shC, sh control) were used as indicated. a–d ER Ca2+ content and release. To induce Ca2+ release from ER, the cells were challenged with ATP, which evokes a rapid discharge from inositol 1,4,5-phosphate receptors (IP3Rs). a, c Representative traces are shown. ER calcium release (mean ± SEM) is quantified by the bars and expressed as μM/s. b, d The steady-state Ca2+ content. Bars are mean ± SEM of at least eight traces from three independent experiments. e, i Apoptosis upon treatment with hydrogen peroxide (H2O2), menadione (MEN), or etoposide (ETO), measured by cytofluorimetry of Annexin V/PI+ cells in the indicated cells. Bars represent the percentage of Annexin V/PI-positive cells (mean ± SEM from five independent experiments). f–h, l–n Cytoplasmic Ca2+ release was measured upon the indicated treatments. Bars are mean ± SEM of 12 measurements from three independent experiments. The asterisks indicate statistically significant differences. *P < 0.05; **P < 0.005; ***P < 0.001

