
Fig. 3.
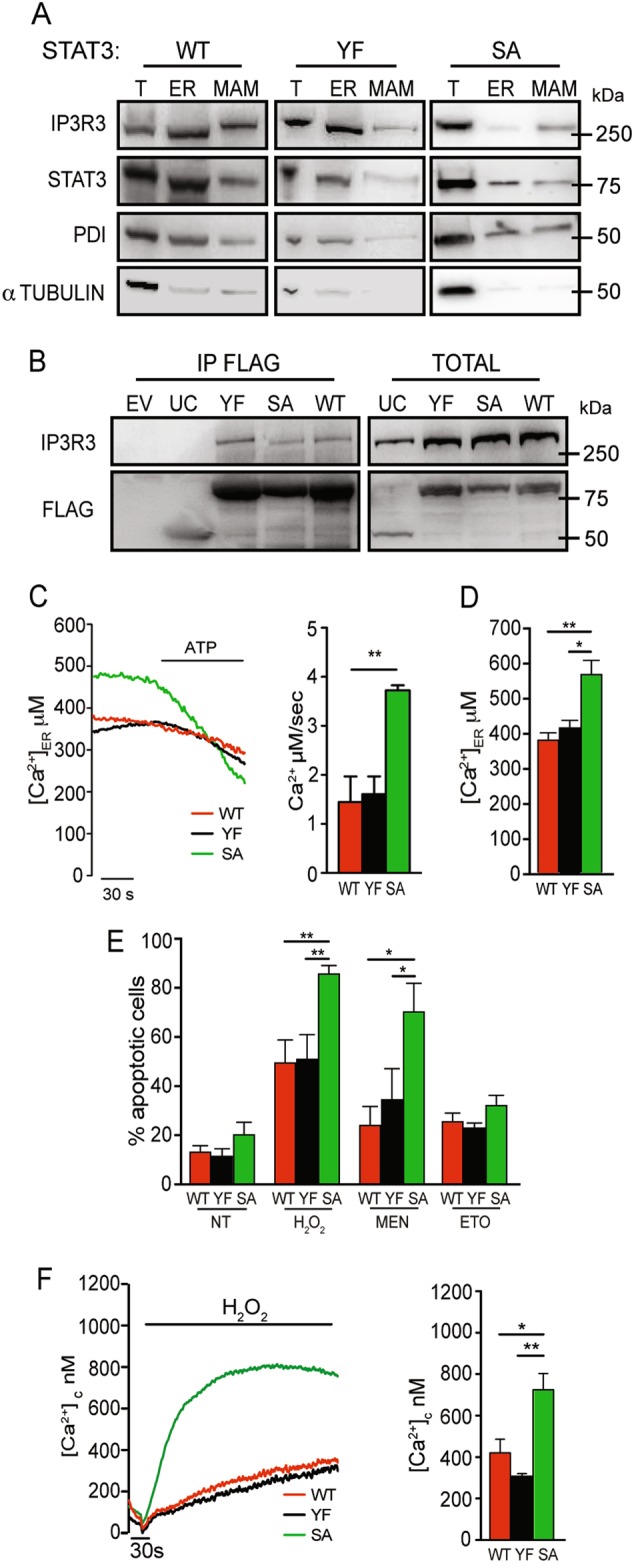
Characterization of STAT3-null MEFs replaced with WT or mutant STAT3. a Whole-cell lysates from STAT3 null MEF cells stably expressing wild type (WT), YF-, or SA-STAT3 were fractionated and analysed by Western blot. b HEK293 cells overexpressing IP3R3 were transiently transfected with flagged wild type or mutant STAT3 (WT, YF, SA) or with an unrelated control (UC), and immunoprecipitated with anti-flag antibodies followed by Western blot. EV empty vector. c, d ER Ca2+ release (c) and content (d) induced by treatment with ATP in MEFs expressing STAT3WT (red line), STAT3YF (black line) or STAT3SA (green line), measured as described in the legend to Fig. 1. Bars are mean ± SEM of 10 measurements from three independent experiments. e Apoptosis in response to hydrogen peroxide (H2O2), menadione (MEN), or etoposide (ETO), assessed in STAT3WT, SA, or YF MEFs by cytofluorimetric analysis of Annexin V/PI+ cells. Mean ± SEM from five independent experiments. NT, untreated. f Cytoplasmic Ca2+ release in STAT3WT, SA, or YF MEF cells upon H2O2 stimulation. Bars represent the mean ± SEM of 16 measurements. The asterisks indicate statistically significant differences. **P < 0.005; ***P < 0.001