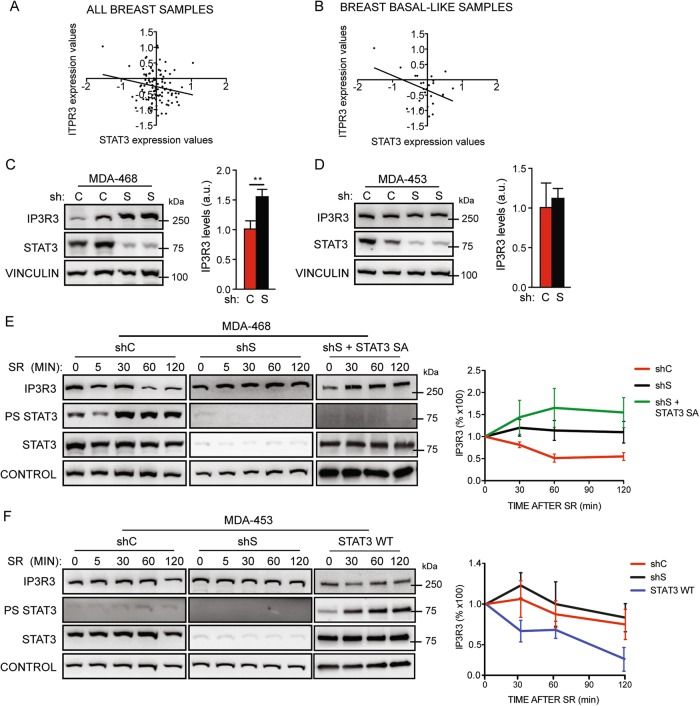
Fig. 4.
STAT3-mediated regulation of IP3R3 protein levels in breast primary tumors and cell lines. a, b STAT3:IP3R3 anti-correlation in breast cancer patients from the CPTAC, TCGA Cancer Proteome Study of Breast Tissue dataset, considering all tumor subtypes (a, Pearson coefficient = −0.18, P = 0.06) or basal-like tumor samples (b, Pearson coefficient = −0.41, P = 0.04). c, d IP3R3 levels upon STAT3 silencing in MDA-MB-468 (c) or in MDA-MB-453 (d) cells. shS shSTAT3, shC sh control. Bars represent mean values ± SEM of four independent experiments. e, f IP3R3 levels upon starvation and serum restimulation (SR) in MDA-MB-468 (e) or MDA-MB-453 (f) cells silenced or not for STAT3 and overexpressing STAT3 SA or WT (shS, shSTAT3; shC, sh control). The graphs on the right show the relative quantification of IP3R3 levels from at least four independent experiments, as mean ± SEM. P values were calculated by two-way ANOVA. e, shC vs shS, P < 0.001; shC vs shS + STAT3 SA, P < 0.001; shS vs shS + STAT3 SA, ns. f, shC vs shS, ns; shC vs STAT3 WT, P < 0.05; shS vs STAT3 WT, P < 0.01

