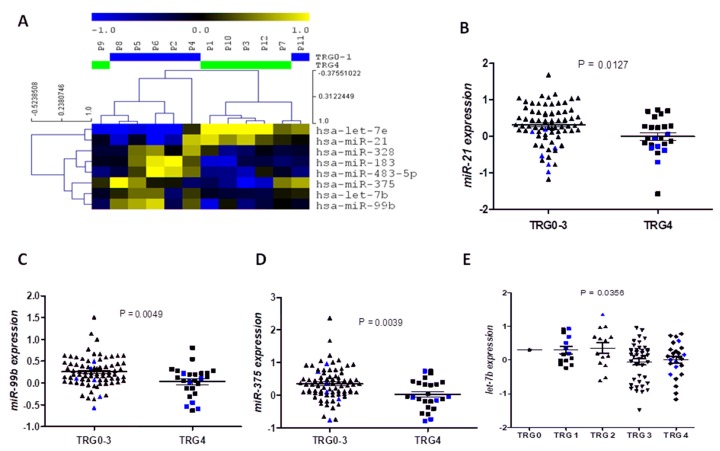
Fig 1. Identification of miRNAs related to treatment response.
A) Hierarchical cluster analysis showing the 8 miRNAs identified differentially expressed in TRG4 vs TRG0-1 samples in the screening phase. B) miR-21, C) miR-99b, D) miR-375 and E) let-7e expression levels in the whole cohort according treatment response (TRG). The black bars in the scatter plots indicate mean ± SEM, and in blue we have highlighted the values from the 12 samples included in the screening phase. TRG 0–3 group is composed of 70 patients, one TRG0, 14 TRG1, 14 TRG2 and 41 TRG3, while the TRG4 group is composed of 26 patients.

