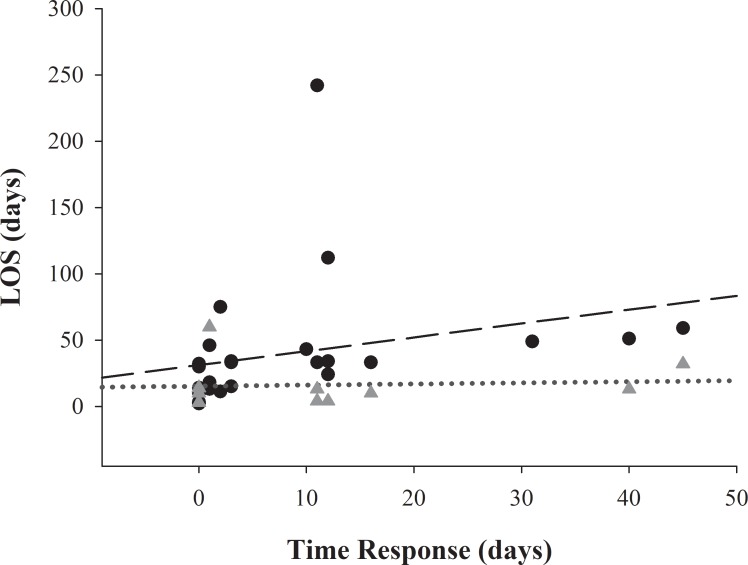
Fig 3. Correlation between time to response (TR) and length of stay (LOS).
Triangles represent TR and ICU-LOS pairs, and dotted line shows regression line for TR and ICU-LOS (ρ = 0.44; P = 0.06). Circles represent TR and Total-LOS pairs, and long dash shows regression line for TR and Total-LOS (ρ = 0.70; P < 0.01).

