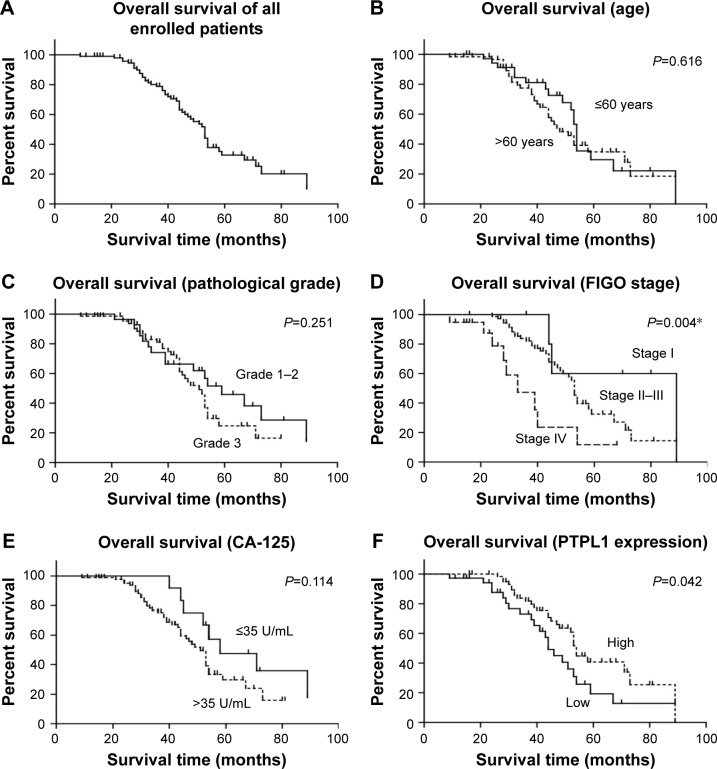
Figure 2.
Kaplan–Meier survival analysis of overall survival according to clinicopathological characteristics.
Notes: The overall survival curve of our enrolled cohort was shown (A). Patients’ age (B) and pathological grade (C) had no prognostic significance. Patients with advanced FIGO stages (D) and lower CA-125 levels (E) showed better overall survival. In addition, lower PTPL1 protein expression level was identified as an unfavorable prognostic factor by univariate analysis (F). *p<0.05.
Abbreviations: CA-125, cancer antigen 125; PTPL1, protein tyrosine phosphatase L1.

