Abstract
Background
GATA3 functions as a tumor suppressor and has been observed in multiple types of cancer, but the effects and mechanisms of GATA3 in osteosarcoma (OS) are not yet known.
Methods
The GATA3 expression in OS cells and tissues were detected using quantitative reverse-transcription PCR and Western blotting assay. CCK-8 assay, colony formation assay, wound healing assay as well as transwell assay, were performed to determine the effects of GATA3 on cell proliferation, migration and invasion. ChIP and qChIP as well as luciferase assay were performed whether GATA3 transcriptionally regulated slug expression.
Results
GATA3 was downregulated in OS cells and tissues. The GATA3 expression was closely associated with tumor size as well as metastasis. GATA3 significantly suppressed OS cells proliferation, migration and invasion. EMT-associated transcript factor, slug, was transcriptionally inhibited by GATA3, thereby regulation of EMT in OS.
Conclusion
GATA3 serves as a tumor suppressor in OS and suppresses the progression and metastasis of OS through regulation of slug.
Keywords: GATA3, osteosarcoma, epithelial–mesenchymal transition, proliferation, migration
Introduction
Osteosarcoma (OS), a primary malignant bone cancer, occurs mainly in children and adolescents.1 The incidence of OS is approximately 30 new cases per million in the world annually.2,3 OS has a high propensity for lung metastases.4–6 Because of highly aggressive and rapid metastases, the patients with OS have a 3–5 year survival rate of 5%–20%.7 Therefore, it is necessary to further investigate the mechanisms underlying the occurrence, progression, invasion, and metastasis of OS.
GATA3, a transcript factor, belongs to the GATA family which comprises of six members that are expressed in a tissue-specific manner.8–13 Previous studies have revealed that GATA3 plays a key role in mammary epithelial cell differentiation as well as mammary gland homeostasis.8,9,14–16 Loss of GATA3 has been reported to promote breast cancer metastasis.17–22 However, the function of GATA3 in OS is not yet known.
Epithelial–mesenchymal transition (EMT) is a complex cellular process; the main characteristic of EMT is loss of cell polarity in epithelial cells as well as development of characteristics of interstitial cells, which promotes the migration and invasion ability of cancer cells. Multiple works have suggested that EMT is associated with OS metastasis.23–26
In the present study, we identified that GATA3 expression was downregulated in OS cell lines and tissues. GATA3 expression was remarkably associated with tumor size as well as metastasis and the prognosis of OS. Therefore, the effects and detailed molecular mechanism of GATA3 in OS progression were explored. The results indicated that ectopic expression of GATA3 was able to suppress cell proliferation, migration, and invasion in human OS cell lines. Moreover, GATA3 inhibited EMT in OS cell lines though regulation of slug expression. Therefore, it is proposed that GATA3 might as a tumor suppressor in OS development and as a potential therapeutic target.
Materials and methods
Cell lines and culture
The human OS cell lines, Saos2 and U2OS, and human fetal osteoblastic cell lines 1.19 (hFOB 1.19) and HEK-293T were purchased from American Type Culture Collection (Manassas, VA, USA). Saos2, U2OS, and HEK-293T cells were cultured in Dulbecco’s Modified Eagle’s Medium (DMEM; Gibco, Los Angeles, CA, USA) supplemented with 10% fetal bovine serum (FBS; HyClone, Logan, UT, USA) at 37°C in a humidified atmosphere with 5% CO2. The hFOB 1.19 cells were cultured in DMEM/Ham’s F-12 (HyClone) supplemented with 10% FBS and geneticin (400 mg/mL) at 34°C with 5% CO2.
Tissue specimens
OS tissues and adjacent normal tissues were obtained from patients who were diagnosed as having OS. All patients had not received any treatment of radiotherapy or chemotherapy before the surgical excision. These tissue samples were immediately frozen in liquid nitrogen before using. Our studies were approved by the institutional ethics committee of People’s Hospital of Juxian. Written informed consent was obtained from each patient.
Transfections
Briefly, U2OS and Saos2 cells were placed in six-well culture plates at a concentration of 2×10⁵ cells/well. Following 24 hours of culturing (70% confluence), cells were transfected with 2.5 µg vector or FLAG-GATA3 plasmid or 50 nM scramble siRNA or GATA3 siRNA using Lipo-fectamine 2000 (Thermo Fisher Scientific, Waltham, MA, USA) according to the manufacturer’s instructions. After transfection for 48 hours, the transfection efficiency was determined by quantitative reverse-transcription PCR (qRT-PCR) and western blotting assay. The experiments were independently repeated three times.
Western blotting analysis
U2OS and Saos2 cells were transfected with FLAG-GATA3 plasmid or GATA3 siRNA for 48 hours. Subsequently, cells were collected and lysis by RIPA protein extraction reagent supplemented with a protease inhibitor cocktail (Roche, Pleasanton, CA, USA). The concentration of protein was quantified using the BCA Protein Quantifcation kit (Pierce, Waltham, MA, USA) according to the manufacturer’s instructions. A total of 40 µg protein was separated by 10% SDS-PAGE and transferred to nitrocellulose membranes (Sigma-Aldrich Co., St Louis, MO, USA). The membranes were blocked with 5% skim milk (OriGene Technologies, Inc., Beijing, People’s Republic of China) for 1 hour at room temperature. Subsequently, the membranes were incubated with antibodies, such as GATA3 (1:2,000, Abcam, Cambridge, UK), E-cadherin antibody (1:2,000, Abcam), N-cadherin antibody (1:2,000, Abcam), vimentin antibody (1:2,000, Abcam), slug (1:1,000, Abcam), snail (1:2,000, Abcam), twist1 (1:1,000, Abcam), and β-actin antibody (1:5,000, Abcam) overnight at 4°C. After washing with TBST buffer three times, the membranes were incubated with horseradish peroxidase-coupled (HRP) secondary antibody (1:5,000, Abcam) at room temperature for 1 hour. Finally, the blots were visualized using Western Lighting Chemiluminescence Reagent Plus (PerkinElmer, Inc., Waltham, MA, USA).
qRT-PCR
Total RNA was extracted from OS cells and tissues using TRIzol reagent (Invitrogen, Carlsbad, CA, USA; Thermo Fisher Scientific, Inc., Waltham, MA, USA) according to the manufacturer’s protocol. The RNA was reverse transcribed by using the High-Capacity RNA-to-cDNA™ kit (Thermo Fisher Scientific, Inc.). qPCR analysis was performed using SYBR-Green Mix (Roche Diagnostics). The primer sequences were as follows: GATA3 forward: 5′-GCTTCACAATATTAACAGACCC-3′, reverse: 5′-TTAAACGAGCTGTTCTTGGG-3′; E-cadherin forward: 5′-TACGCCTGGGACTCCACCTA-3′, reverse: 5′-CCAGAAACGGAGGCCTGAT-3′; N-cadherin, forward: 5′-CGAGCCGCCTGCGCTGCCAC-3′, reverse: 5′-CGCTGCTCTCCGCTCCCCGC-3′; vimentin forward: 5′-TACAGGAAGCTGCTGGAAGG-3′, reverse: 5′-ACCAGAGGGAGTGAATCCAG-3′; GAPDH forward: 5′-CGGAGTCAACGGATTTGGTCGTAT-3′, reverse, 5′-AGCCTTCTCCATGGTGGTGAAGAC-3′. The ther-mocycling conditions were as follows: 95°C for 5 minutes and 30 seconds, and 40 cycles (15 seconds at 95°C, 1 minute at 60°C). Relative mRNA expression was calculated using 2−ΔΔCq method.27
Colony forming assay
After transfection for 48 hours, approximately 5×10³ U2OS or Saos2 cells were placed in six-well plates and incubated with serum-free DMEM medium for 14 days, then the colonies were stained with 0.1% crystal violet at room temperature for 15 minutes. The numbers of colonies (cells >50) were counted in six randomly selected microscopic fields. The experiments were independently repeated three times.
Cell viability assay
CCK8 assay was performed to evaluate cell viability. Transfected U2OS and Saos2 cells were placed in a 96-well plate with 200 µL DMEM medium at a concentration of 3×10³ cells/well. Twenty microliter CCK8 solution (Beyotime, Jiangsu, People’s Republic of China) was added to each well at 0, 24, 48, and 72 hours. After incubating for 30 minutes, the absorbance 450 nm was measured on a microplate reader. The experiments were independently repeated three times.
Transwell invasion assay
Transwell invasion assay was performed to determine the effect of GATA3 on cell invasion ability. Briefly, 3×10⁵ transfected U2OS or Saos2 cells in 400 µL serum-free DMEM medium were placed into the upper chamber coated with Matrigel (BD Biosciences, Franklin Lakes, NJ, USA). The lower chamber contained 500 µL DMEM media containing 10% FBS. After incubation at 37°C for 18 hours, the cells remaining on the upper membrane were removed with a cotton swab, and the cells that had invaded through the membrane were stained with 0.1% crystal violet at room temperature for 10 minutes. The number of invaded cells was counted using a light microscope. The experiments were independently repeated three times.
Wound healing assay
Wound healing assay was performed to determine the effect of GATA3 on cell migration ability. In brief, transfected U2OS and Saos2 cells were placed into each well of 12-well plates, and then, a straight-line wound was created using a pipette tip when cell layers reached confluence. Then, cells were washed with cold-PBS three times and cultured in serum-free DMEM medium for 48 hours. The closure of the wounds was evaluated by light microscopy. The experiments were independently repeated three times.
Luciferase reporter assays
The pGL3-basic vector was purchased from Promega (Madison, WI, USA) and used for luciferase reporter assay. The promoter region target of slug was cloned into the pGL3-basic (pGL3-slug). HEK-293T cells were placed in a 24-well plate at a concentration of 1×10⁵ cells/well and were cotransfected with pGL3-slugand vector or FLAG-GATA3 plasmid using Lipofectamine 2000 (Invitrogen). After transfection for 24 hours, the luciferase activities were determined using Dual Luciferase Reporter Assay System (Promega) according to manufacturer’s protocol. The experiments were independently repeated three times.
Statistical analyses
Statistical analyses were performed using SPSS software. One-way analysis of variance was used in multiple group analysis, and paired t-test was adopted to assess data between two experimental groups. Overall survival curves were estimated by the Kaplan–Meier method and compared by the log-rank test. Data are expressed as the mean ± SD. *P<0.05 was considered to indicate a statistically significant difference.
Result
GATA3 downregulates in OS tissues and cells; OS patients with high level of GATA3 had better prognosis
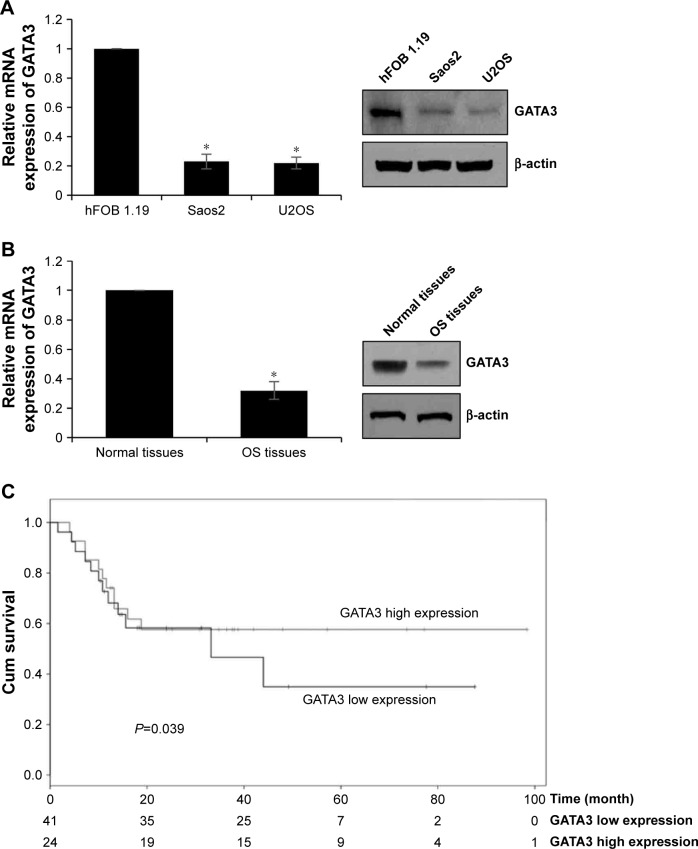
To determine the function of GATA3 in OS, we first detected the expression of GATA3 in OS cells and OS tissues using qRT-PCR and Western blotting assay and compared these with those levels in hFOB 1.19 cells and normal tissues. The results of qRT-PCR and Western blotting suggested that the expression of GATA3 in OS cells and OS tissues was obviously lower than that in hFOB 1.19 cells and normal tissues, respectively (Figure 1A and B). Subsequently, we divided patients with OS into two groups, low expression of GATA3 group and high expression of GATA3 group, to analyze the relationship between GATA3 expression and overall survival of patients with OS using Kaplan–Meier survival assay. The results showed that high expression of GATA3 was correlated with high overall survival rate for patients with OS (Figure 1C, P=0.039). Meanwhile, the expression of GATA3 was associated with tumor size and tumor stage as well as metastasis stage (Table 1). Our findings suggest that GATA3 is downregulated in OS cells and tissues, and the expression of GATA3 is associated with the prognosis of OS patients.
Figure 1.
GATA3 is downregulated in OS tissues and cells, OS patients with high level of GATA3 had better prognosis.
Notes: (A) The expression of GATA3 in OS tissues and normal tissues using qRT-PCR, *P<0.05, vs normal tissues. (B) The expression of GATA3 in OS cell lines using qRT-PCR, *P<0.05, vs hFOB 1.19 cells. (C) The survival curves based on GATA3 relative expression and overall survival was plotted using Kaplan–Meier method.
Abbreviations: qRT-PCR, quantitative reverse-transcription PCR; OS, osteosarcoma.
Table 1.
Clinicopathologic variables in 65 OS patients
| Variables | n=65 | GATA3 expression
|
P-value | |
|---|---|---|---|---|
| Low (n=41) | High (n=24) | |||
|
| ||||
| Gender | ||||
| Male | 38 | 24 | 14 | 0.987 |
| Female | 27 | 17 | 10 | |
| Age | ||||
| <20 | 29 | 20 | 9 | 0.377 |
| ≥20 | 36 | 21 | 15 | |
| Tumor size | ||||
| ≥5 cm | 40 | 30 | 10 | 0.012 |
| <5 cm | 25 | 11 | 14 | |
| TNM stage | ||||
| I–II | 32 | 16 | 16 | 0.031 |
| III–IV | 33 | 25 | 8 | |
| Metastasis | ||||
| Yes | 36 | 28 | 8 | 0.006 |
| No | 29 | 13 | 16 | |
| Slug expression | ||||
| High | 40 | 30 | 10 | 0.012 |
| Low | 25 | 11 | 14 | |
Abbreviation: OS, osteosarcoma.
GATA3 inhibits proliferation of OS cells in vitro
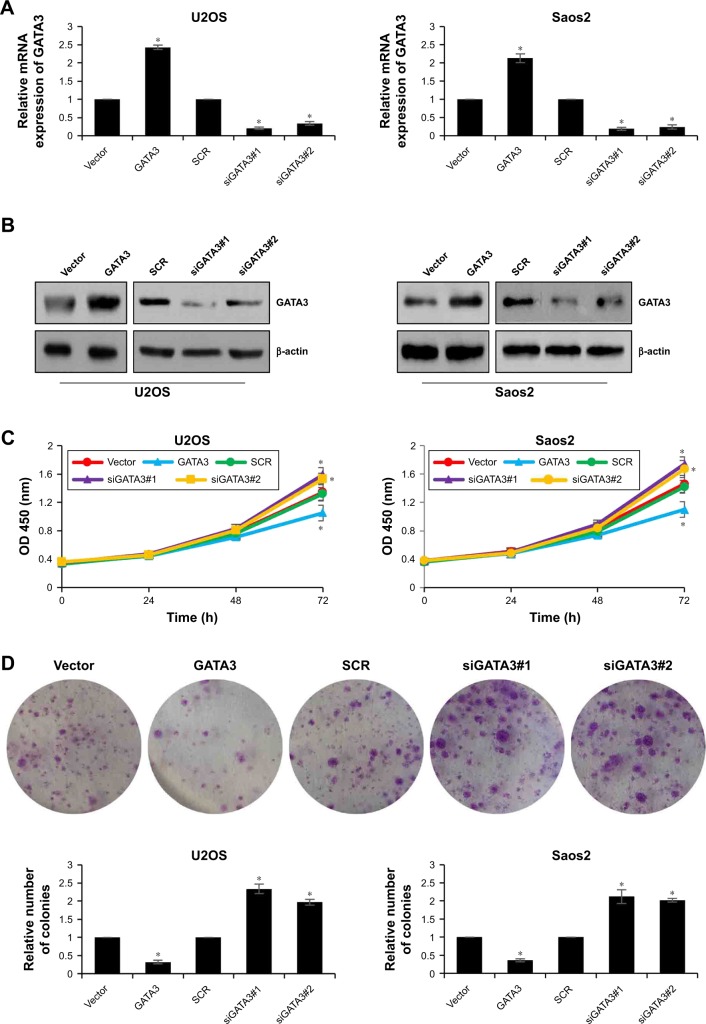
To further decipher the function of GATA3 on cell proliferation, we first overexpressed or knocked down GATA3 in U2OS and Saos2 cells using FLAG-GATA3 plasmid or GATA3 siRNA, respectively. The expression of GATA3 was determined by qRT-PCR and western blotting assay (Figure 2A and B). The functions of GATA3 in OS cells were evaluated using the CCK-8 proliferation assay and colony formation assay. The proliferative capability of OS cells was detected at 0, 24, 48, and 72 hours. The results indicated that ectopic expression of GATA3 inhibited the proliferative capability of OS cells compared with control group; however, inhibition of GATA3 promoted the proliferative capability of OS cells compared with control group, and the difference was more apparent at 72 hours (Figure 2C). Similar results were observed in colony formation assay; the number of colonies were decreased when cells were transfected with FLAG-GATA3 plasmid, compared with control group; however, inhibition of GATA3 increased the number of colonies, compared with control group (Figure 2D). These results suggest that overexpression of GATA3 inhibits proliferation of OS cells.
Figure 2.
Overexpression of GATA3 inhibits proliferation of OS cells in vitro.
Notes: (A, B) GATA3 was overexpressed or knocked down in U2OS and Saos2 cells, respectively. After transfection for 48 hours, the expression of GATA3 was determined using qRT-PCR and western blotting assay. *<0.05, vs vector or scramble siRNA. (C) The effect of GATA3 on OS cell proliferation was evaluated within 72 hours using CCK-8 assay. *<0.05, vs vector or scramble siRNA. (D) The effect of GATA3 on OS cell proliferation was evaluated using colony formation assay. *<0.05, vs vector or scramble siRNA.
Abbreviations: qRT-PCR, quantitative reverse-transcription PCR; OS, osteosarcoma.
GATA3 inhibits migration and invasion of OS cells in vitro
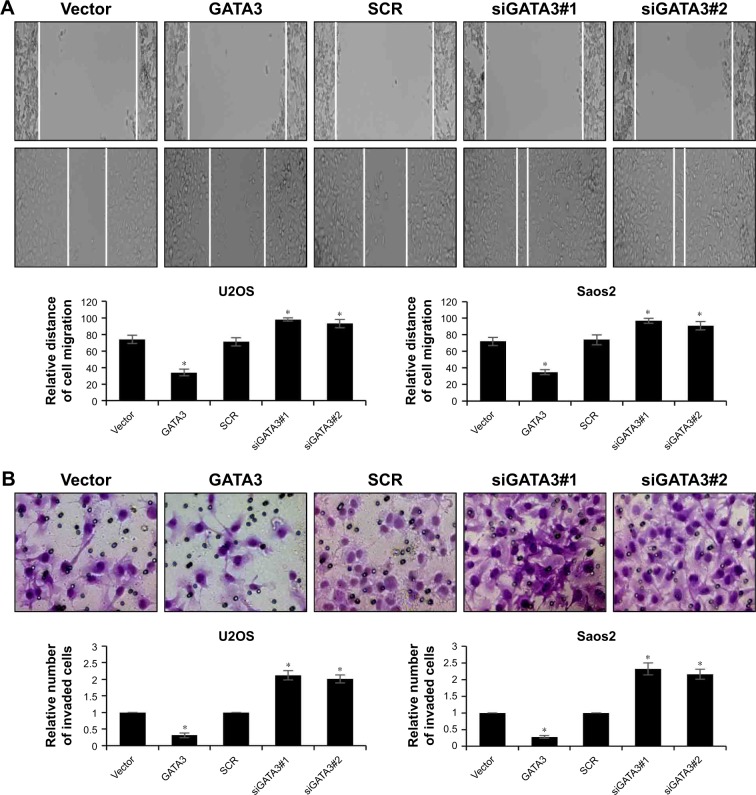
Subsequently, we determined whether GATA3 regulated the migration and invasion of OS cells using wound healing assay and transwell invasion assay. The results of wound healing assay suggested that overexpression of GATA3 significantly decreased the relative distance of cell migration; however, inhibition of GATA3 obviously increased the relative distance of cell migration (Figure 3A). The results of transwell invasion assay were also consistent with wound healing assay, indicating that ectopic expression of GATA3 suppressed the invasion capability of U2OS and Saos2 cells compared with control group; however, inhibition of GATA3 promoted the invasion capability of OS cells compared with control group (Figure 3B). Taken together, our findings show that overexpression of GATA3 inhibits migration and invasion of OS cells in vitro.
Figure 3.
GATA3 inhibits migration and invasion of OS cells in vitro.
Notes: (A) GATA3 was overexpressed or knocked down in U2OS and Saos2 cells, respectively. After transfection for 48 hours, the effect of GATA3 on OS cell migration was assessed using wound healing assay. *<0.05, vs vector or scramble siRNA. (B) GATA3 was overexpressed or knocked down in U2OS and Saos2 cells, respectively. After transfection for 48 hours, the effect of GATA3 on OS cell migration was assessed using Transwell invasion assay. *<0.05, vs vector or scramble siRNA.
Abbreviation: OS, osteosarcoma.
Overexpression of GATA3 upregulates E-cadherin and downregulates the expression of N-cadherin and vimentin in OS cells
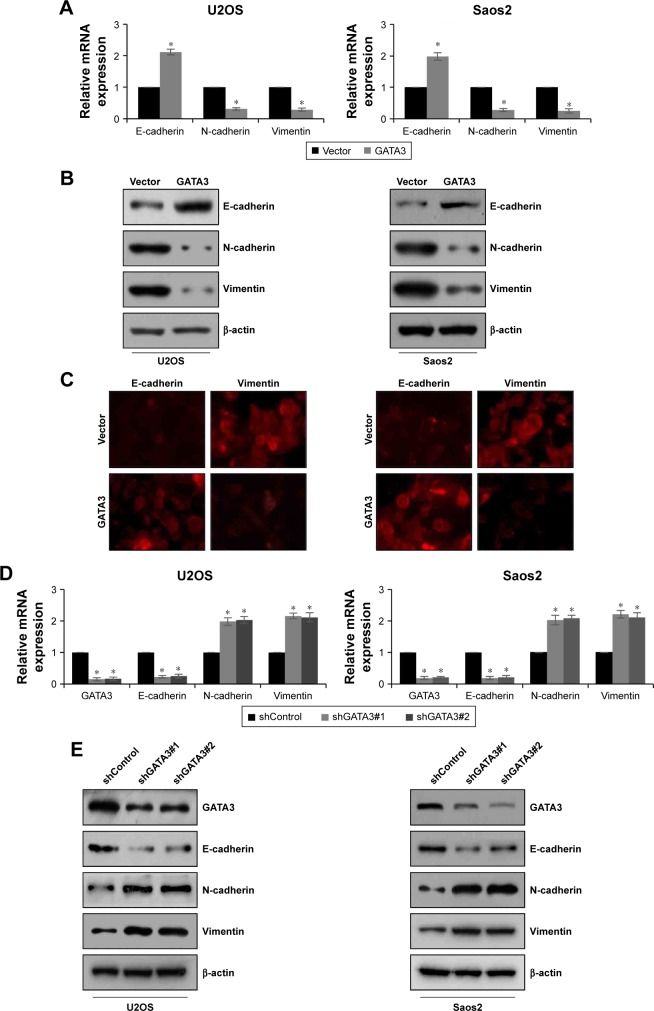
EMT is a complex progress which is associated with cancer metastasis. To evaluate the effect of GATA3 on EMT, proteins related to EMT, including E-cadherin, N-cadherin, and vimentin, were detected using qRT-PCR and western blotting assay. The mRNA and protein levels of E-cadherin were obviously reduced, whereas mRNA and protein levels of N-cadherin and vimentin were all dramatically raised when cells were transfected with FLAG-GATA3 plasmid (Figure 4A and B) in U2OS and Saos2. Moreover, immunofluorescence assay also confirmed that ectopic expression of GATA3 increased the expression of E-cadherin and decreased the expression of vimentin (Figure 4C). However, the mRNA and protein levels of E-cadherin were obviously increased, whereas the mRNA and protein levels of N-cadherin and vimentin were all dramatically decreased when cells were transfected with GATA3 shRNA to stably knock down GATA3 (Figure 4D and E), suggesting that overexpression of GATA3 may suppress EMT of OS cells.
Figure 4.
GATA3 upregulates E-cadherin and downregulates the expression of N-cadherin and vimentin in OS cells.
Notes: (A, B) GATA3 was overexpressed in U2OS and Saos2 cells. The expression of EMT markers, such as epithelial marker (E-cadherin) and mesenchymal markers (N-cadherin and vimentin), were detected by qRT-PCR and western blotting assay. *<0.05, vs vector. (C) GATA3 was overexpressed in U2OS and Saos2 cells. The expression of E-cadherin and vimentin were detected by immunofluorescence assay using anti-E-cadherin and anti-vimentin antibodies. (D, E) GATA3 was stable knocked down in U2OS and Saos2 cells using two GATA3 shRNA. The expression of GATA3 and EMT markers were detected by qRT-PCR and western blotting assay. *<0.05, vs shControl.
Abbreviations: EMT, epithelial–mesenchymal transition; qRT-PCR, quantitative reverse-transcription PCR; OS, osteosarcoma.
GATA3 is a direct transcriptional repressor of slug in OS tissues
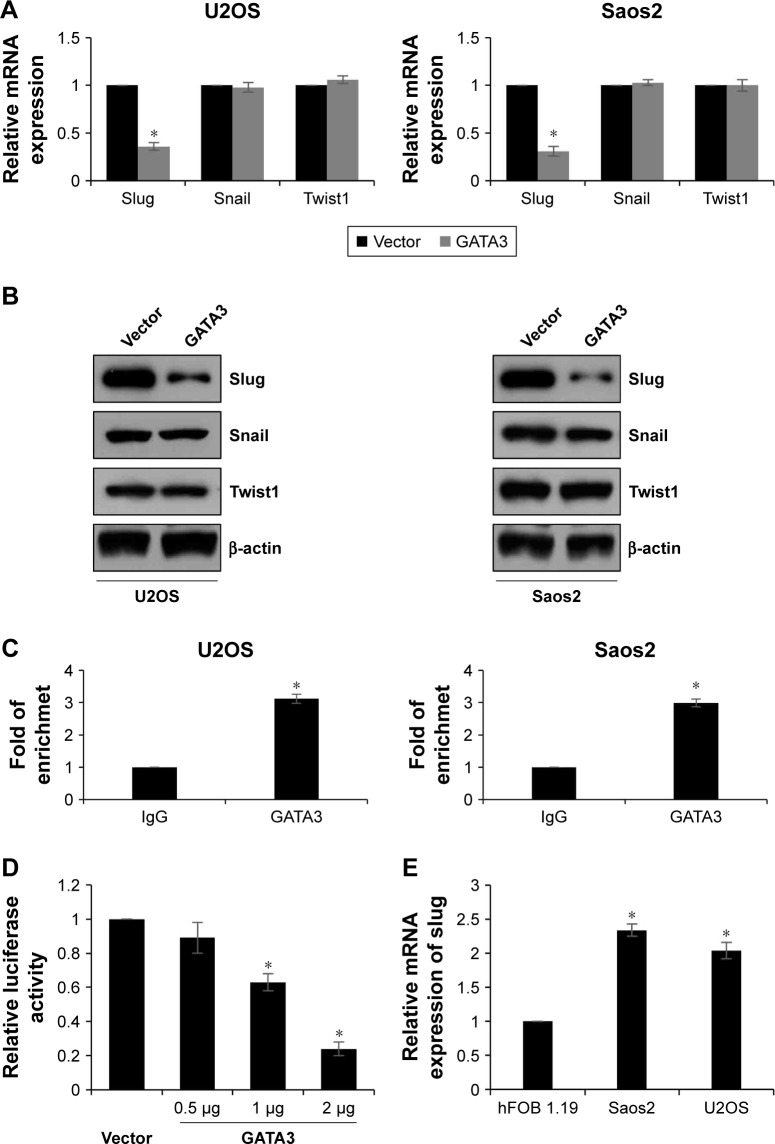
EMT-associated transcription factors, such as slug, snail, and twist1, have been reported to play key roles in EMT. So, we next detected whether GATA3 regulated those transcription factors. As shown in Figure 5A and B, we found that both mRNA and protein levels of slug were decreased when U2OS and Saos2 cells transfected with FLAG-GATA3 plasmid; however, overexpression of GATA3 had no effect on the expression of snail and twist1 (Figure 5A and B). GATA3, as a transcription factor, we assumed might transcriptionally regulate slug. Subsequently, we performed ChIP and qChIP assay to determine whether GATA3 bound the promoter region of slug. The results demonstrated that GATA3 could bind the promoter region of slug (Figure 5C). Subsequently, we cloned the promoter region of slug into pGL3-basic plasmid (pGL3-slug). HEK 293 T cells were cultured and cotransfected with pGL3-slug and vector or GATA3 plasmid. The relative luciferase activity was obviously decreased in cells with FLAG-GATA3 plasmid, compared with cells treated with vector (Figure 5D). We also determined the expression of slug in U2OS, Saos2, and hFOB 1.19 cells and found slug expression was the opposite of that of GATA3 (Figure 5E); moreover, we found the slug expression was negatively correlated with GATA3 expression in OS tissues (Table 1). Taken together, our work indicate that slug is a direct target of GATA3 and GATA3 can downregulate the expression of slug in OS.
Figure 5.
GATA3 is a direct transcriptional repressor of slug in OS tissues.
Notes: (A, B) GATA3 was overexpressed in U2OS and Saos2 cells. The expression of EMT-associated transcription factors, including slug, snail, and twist1, were detected using qRT-PCR and western blotting assay. *<0.05, vs vector. (C) ChIP and qChIP assay was performed to determine whether GATA3 could bind the promoter region of slug. *<0.05, vs IgG. (D) Luciferase reporter assay was performed to determine whether GATA3 transcriptionally regulated slug. *<0.05, vs vector. (E) The expression of slug in OS cell lines using qRT-PCR, *P<0.05, vs hFOB 1.19 cells.
Abbreviations: EMT, epithelial–mesenchymal transition; qRT-PCR, quantitative reverse-transcription PCR; OS, osteosarcoma.
Discussion
Accumulating evidence has shown that GATA3 play key roles in cancer development.28–30 Here, we first revealed that GATA3 was downregulated in OS. CCK-8 assay and colony formation assay demonstrated that GATA3 inhibited OS cells proliferation.
Then analyses of OS cells migration and invasion reveal that overexpression of GATA3 can effectively suppress the migration and invasion abilities of OS cells. In addition, ectopic expression of GATA3 promoted E-cadherin expression but decreased the expression of N-cadherin and vimentin in OS cells in vitro. E-cadherin is an epithelial marker, and downregulation of E-cadherin will increase the cellular motility, leading cancer cells to enter into mesenchymal state as well as metastasize.31 N-cadherin and vimentin are markers of cancer cells undergoing an EMT and play a role in migration.32,33 Thus, GATA3 acts as a tumor suppressor in OS and inhibits migration and invasion through suppressing EMT. At last, ChIP and qChIP assays as well as dual luciferase assay revealed that slug was a downstream target of GATA3 and that GATA3 could downregulate the slug expression in OS cells. Slug is a transcription factor which promotes EMT in multiple cancers.34 Therefore, GATA3 suppressed EMT through regulation of slug in OS.
However, there are still some limitations in our work. First, immunohistochemistry of GATA3 in the normal and OS samples need to be further investigated, as this is a better way to illustrate the expression of GATA3 in OS. Second, although our findings suggested that GATA3 could suppress cell proliferation, migration, and invasion in OS cells in vitro, whether GATA3 plays the same roles in vivo is not yet known. So, it is necessary to perform in vivo experiments to further explore the functions of GATA3. Additionally, the other upstream molecules of GATA3 and other downstream targets of GATA3 should be investigated.
In summary, GATA3 serves as a tumor suppressor in OS. GATA3 is downregulated in OS and the expression of GATA3 is associated with tumor size and metastasis. Overexpression of GATA3 not only inhibits the proliferation of OS cells but also suppresses OS cells migration and invasion. Furthermore, GATA3 can directly downregulate the EMT-related transcription factor, slug, expression. We thus present GATA3 as a potential therapeutic target.
Footnotes
Disclosure
The authors report no conflicts of interest in this work.
References
- 1.Siegel RL, Miller KD, Jemal A. Cancer statistics, 2016. CA Cancer J Clin. 2016;66(1):7–30. doi: 10.3322/caac.21332. [DOI] [PubMed] [Google Scholar]
- 2.Bielack SS, Hecker-Nolting S, Blattmann C, Kager L. Advances in the management of osteosarcoma. F1000Res. 2016;5:2767. doi: 10.12688/f1000research.9465.1. [DOI] [PMC free article] [PubMed] [Google Scholar]
- 3.He X, Gao Z, Xu H, Zhang Z, Fu P. A meta-analysis of randomized control trials of surgical methods with osteosarcoma outcomes. J Orthop Surg Res. 2017;12(1):5. doi: 10.1186/s13018-016-0500-0. [DOI] [PMC free article] [PubMed] [Google Scholar]
- 4.Chi SN, Conklin LS, Qin J, et al. The patterns of relapse in osteosarcoma: the Memorial Sloan-Kettering experience. Pediatr Blood Cancer. 2004;42(1):46–51. doi: 10.1002/pbc.10420. [DOI] [PubMed] [Google Scholar]
- 5.Crompton BD, Goldsby RE, Weinberg VK, Feren R, O’Donnell RJ, Ablin AR. Survival after recurrence of osteosarcoma: a 20-year experience at a single institution. Pediatr Blood Cancer. 2006;47(3):255–259. doi: 10.1002/pbc.20580. [DOI] [PubMed] [Google Scholar]
- 6.Gelderblom H, Jinks RC, Sydes M, et al. Survival after recurrent osteosarcoma: data from 3 European Osteosarcoma Intergroup (EOI) randomized controlled trials. Eur J Cancer. 2011;47(6):895–902. doi: 10.1016/j.ejca.2010.11.036. [DOI] [PubMed] [Google Scholar]
- 7.Berner K, Johannesen TB, Berner A, et al. Time-trends on incidence and survival in a nationwide and unselected cohort of patients with skeletal osteosarcoma. Acta Oncol. 2015;54(1):25–33. doi: 10.3109/0284186X.2014.923934. [DOI] [PMC free article] [PubMed] [Google Scholar]
- 8.Kouros-Mehr H, Slorach EM, Sternlicht MD, Werb Z. GATA-3 maintains the differentiation of the luminal cell fate in the mammary gland. Cell. 2006;127(5):1041–1055. doi: 10.1016/j.cell.2006.09.048. [DOI] [PMC free article] [PubMed] [Google Scholar]
- 9.Kaufman CK, Zhou P, Pasolli HA, et al. GATA-3: an unexpected regulator of cell lineage determination in skin. Genes Dev. 2003;17(17):2108–2122. doi: 10.1101/gad.1115203. [DOI] [PMC free article] [PubMed] [Google Scholar]
- 10.Yagi R, Zhu J, Paul WE. An updated view on transcription factor GATA3-mediated regulation of Th1 and Th2 cell differentiation. Int Immunol. 2011;23(7):415–420. doi: 10.1093/intimm/dxr029. [DOI] [PMC free article] [PubMed] [Google Scholar]
- 11.Sellheyer K, Krahl D. Expression pattern of GATA-3 in embryonic and fetal human skin suggests a role in epidermal and follicular morphogenesis. J Cutan Pathol. 2010;37(3):357–361. doi: 10.1111/j.1600-0560.2009.01416.x. [DOI] [PubMed] [Google Scholar]
- 12.Home P, Ray S, Dutta D, Bronshteyn I, Larson M, Paul S. GATA3 is selectively expressed in the trophectoderm of peri-implantation embryo and directly regulates Cdx2 gene expression. J Biol Chem. 2009;284(42):28729–28737. doi: 10.1074/jbc.M109.016840. [DOI] [PMC free article] [PubMed] [Google Scholar]
- 13.Du F, Yuan P, Wang T, et al. The Significance and Therapeutic Potential of GATA3 Expression and Mutation in Breast Cancer: A Systematic Review. Med Res Rev. 2015;35(6):1300–1315. doi: 10.1002/med.21362. [DOI] [PubMed] [Google Scholar]
- 14.Asselin-Labat ML, Sutherland KD, Barker H, et al. Gata-3 is an essential regulator of mammary-gland morphogenesis and luminal-cell differentiation. Nat Cell Biol. 2007;9(2):201–209. doi: 10.1038/ncb1530. [DOI] [PubMed] [Google Scholar]
- 15.Dydensborg AB, Rose AA, Wilson BJ, et al. GATA3 inhibits breast cancer growth and pulmonary breast cancer metastasis. Oncogene. 2009;28(29):2634–2642. doi: 10.1038/onc.2009.126. [DOI] [PubMed] [Google Scholar]
- 16.Kouros-Mehr H, Kim JW, Bechis SK, Werb Z. GATA-3 and the regulation of the mammary luminal cell fate. Curr Opin Cell Biol. 2008;20(2):164–170. doi: 10.1016/j.ceb.2008.02.003. [DOI] [PMC free article] [PubMed] [Google Scholar]
- 17.Kouros-Mehr H, Bechis SK, Slorach EM, et al. GATA-3 links tumor differentiation and dissemination in a luminal breast cancer model. Cancer Cell. 2008;13(2):141–152. doi: 10.1016/j.ccr.2008.01.011. [DOI] [PMC free article] [PubMed] [Google Scholar]
- 18.Wilson BJ, Giguère V. Meta-analysis of human cancer microarrays reveals GATA3 is integral to the estrogen receptor alpha pathway. Mol Cancer. 2008;7:49. doi: 10.1186/1476-4598-7-49. [DOI] [PMC free article] [PubMed] [Google Scholar]
- 19.Bertucci F, Houlgatte R, Benziane A, et al. Gene expression profiling of primary breast carcinomas using arrays of candidate genes. Hum Mol Genet. 2000;9(20):2981–2991. doi: 10.1093/hmg/9.20.2981. [DOI] [PubMed] [Google Scholar]
- 20.Hoch RV, Thompson DA, Baker RJ, Weigel RJ. GATA-3 is expressed in association with estrogen receptor in breast cancer. Int J Cancer. 1999;84(2):122–128. doi: 10.1002/(sici)1097-0215(19990420)84:2<122::aid-ijc5>3.0.co;2-s. [DOI] [PubMed] [Google Scholar]
- 21.Mehra R, Varambally S, Ding L, et al. Identification of GATA3 as a breast cancer prognostic marker by global gene expression meta-analysis. Cancer Res. 2005;65(24):11259–11264. doi: 10.1158/0008-5472.CAN-05-2495. [DOI] [PubMed] [Google Scholar]
- 22.Jiang YZ, Yu KD, Zuo WJ, Peng WT, Shao ZM. GATA3 mutations define a unique subtype of luminal-like breast cancer with improved survival. Cancer. 2014;120(9):1329–1337. doi: 10.1002/cncr.28566. [DOI] [PubMed] [Google Scholar]
- 23.Yang G, Yuan J, Li K. EMT transcription factors: implication in osteosarcoma. Med Oncol. 2013;30(4):697. doi: 10.1007/s12032-013-0697-2. [DOI] [PubMed] [Google Scholar]
- 24.Wang Y, Wang H, Zhou R, et al. Baicalin inhibits human osteosarcoma cells invasion, metastasis, and anoikis resistance by suppressing the transforming growth factor-β1-induced epithelial-to-mesenchymal transition. Anticancer Drugs. 2017;28(6):581–587. doi: 10.1097/CAD.0000000000000495. [DOI] [PubMed] [Google Scholar]
- 25.Jiang R, Zhang C, Liu G, Gu R, Wu H. MicroRNA-126 Inhibits Proliferation, Migration, Invasion, and EMT in Osteosarcoma by Targeting ZEB1. J Cell Biochem. 2017;118(11):3765–3774. doi: 10.1002/jcb.26024. [DOI] [PubMed] [Google Scholar]
- 26.Shen S, Huang K, Wu Y, et al. A miR-135b-TAZ positive feedback loop promotes epithelial-mesenchymal transition (EMT) and tumorigenesis in osteosarcoma. Cancer Lett. 2017;407:32–44. doi: 10.1016/j.canlet.2017.08.005. [DOI] [PubMed] [Google Scholar]
- 27.Livak KJ, Schmittgen TD. Analysis of relative gene expression data using real-time quantitative PCR and the 2(−Delta Delta C(T)) Method. Methods. 2001;25(4):402–408. doi: 10.1006/meth.2001.1262. [DOI] [PubMed] [Google Scholar]
- 28.Xu Y, Pan S, Liu J, et al. GATA3-induced vWF upregulation in the lung adenocarcinoma vasculature. Oncotarget. 2017;8(66):110517–110529. doi: 10.18632/oncotarget.22806. [DOI] [PMC free article] [PubMed] [Google Scholar]
- 29.Wei S, Zhong L, Wang X, Zhang W. Low expression of GATA3 promotes cell proliferation and metastasis in gastric cancer. Cancer Manag Res. 2017;9:769–780. doi: 10.2147/CMAR.S147973. [DOI] [PMC free article] [PubMed] [Google Scholar]
- 30.Klijanienko J, Caly M, Frénaux P, Klos J. GATA3 differential expression in neuroblastoma and nephroblastoma. Cancer Cytopathol. 2018;126(3):215–216. doi: 10.1002/cncy.21952. [DOI] [PubMed] [Google Scholar]
- 31.Polyak K, Weinberg RA. Transitions between epithelial and mesenchymal states: acquisition of malignant and stem cell traits. Nat Rev Cancer. 2009;9(4):265–273. doi: 10.1038/nrc2620. [DOI] [PubMed] [Google Scholar]
- 32.Leader M, Collins M, Patel J, Henry K. Vimentin: an evaluation of its role as a tumour marker. Histopathology. 1987;11(1):63–72. doi: 10.1111/j.1365-2559.1987.tb02609.x. [DOI] [PubMed] [Google Scholar]
- 33.Ramis-Conde I, Chaplain MA, Anderson AR, Drasdo D. Multi-scale modelling of cancer cell intravasation: the role of cadherins in metastasis. Phys Biol. 2009;6(1):016008. doi: 10.1088/1478-3975/6/1/016008. [DOI] [PubMed] [Google Scholar]
- 34.Pradella D, Naro C, Sette C, Ghigna C. EMT and stemness: flexible processes tuned by alternative splicing in development and cancer progression. Mol Cancer. 2017;16(1):8. doi: 10.1186/s12943-016-0579-2. [DOI] [PMC free article] [PubMed] [Google Scholar]


