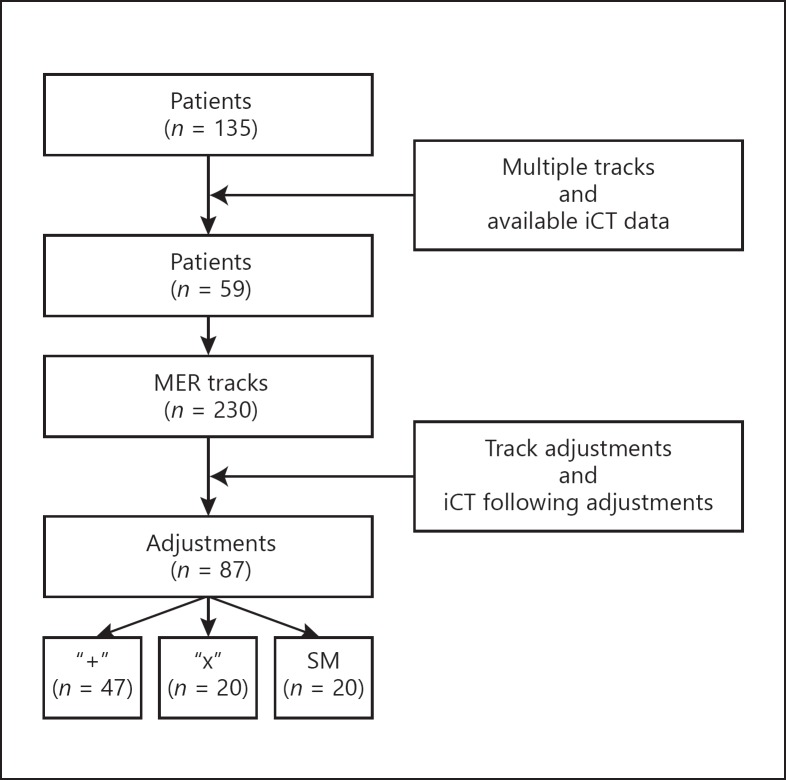
Fig. 2.
Flowchart summarizing reported adjustments, illustrating how the number of analyzed adjustments was derived. Patients were included based on the availability of iCT data and if they had more than 1 track. The adjustments could only be analyzed if track adjustments were required, noted in patient charts, and if subsequent adjustments were monitored by iCT. SM, stage moves.

