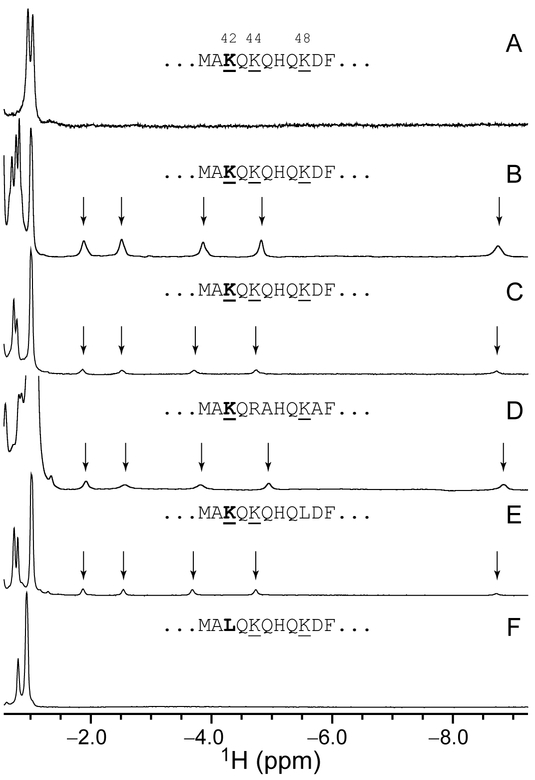
Figure 4.
Upfield region of the 1H NMR spectrum of ferrous GlbN-A. (A) PPDME GlbN-A, pH 7.2, 25 °C; (B) PPDME GlbN-A, pH 9.7, 25 °C; (C) PP GlbN-A, pH 10.9, 25 °C; (D) Synechocystis PP GlbN-A, pH 11.0, 17 °C; (E) PP K48L GlbN-A, pH 11.0, 25 °C; (F) PP K42L GlbN-A, pH 10.9, 25 °C. Data collected in 1H2O with 5–10% 2H2O; alkaline samples were buffered with sodium borate (B) or sodium (bi)carbonate (C–F). Vertical scaling is arbitrary; however, the population of His–Fe–Lys form in (B) is higher than in (C). The Met40–Phe50 sequence is shown for each protein.

