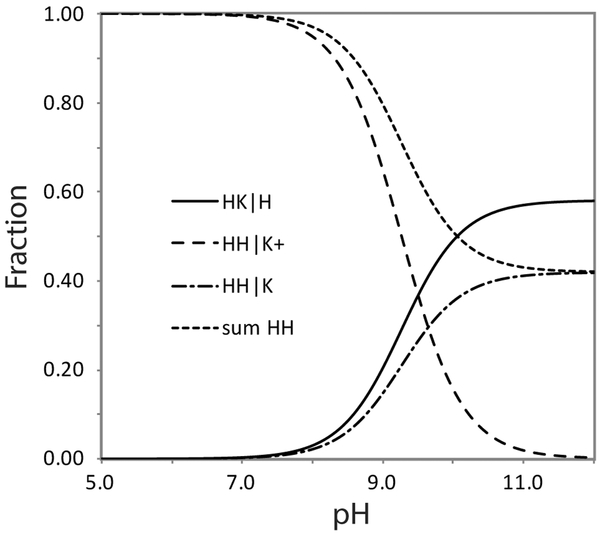
Figure 6.
Population plot obtained with the scheme of Figure 5. The apparent pK of the alkaline transition is 9.26 and the fraction of protein with a distal lysine ligand (HK|H) is 0.55 at pH 10.5. The value of pK3 is then 9.64. K1/K2 is 1.38, corresponding to a free energy difference of 0.8 kJ mol−1 favoring the lysine bound form.

