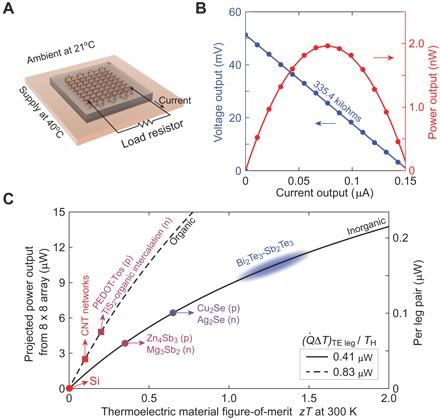
Fig 4. Energy harvesting with thermoelectric coils and a road map for power enhancement.

(A) Schematic illustration of the measurement conditions for evaluating the performance of the harvesting devices. An 8 × 8 array was exposed to an environmental temperature difference of 19°C. (B) Measured power output characteristics of the 8 × 8 coil array, showing a maximum power of 2 nW. (C) Projected power output achievable by using known thermoelectric materials with thermoelectric figure-of-merit zT higher than that of Si (left axis is for an 8 × 8 array; right axis shows values on a per coil basis). These powers correspond to per leg values as indicated in the legend and ideal conversion efficiencies. The dashed and solid lines represent the values from structures obtainable with organic and inorganic materials, respectively (see fig. S12). The zT values used here correspond to averages of p- and n-type materials reported in the literature: CNT networks (29), PEDOT-Tos (30), TiS2-organic intercalation (21), Zn4Sb3 (44), Mg3Sb2 (45), Cu2Se (46), Ag2Se (47, 48), and Bi2Te3-Sb2Te3 (49, 50).
