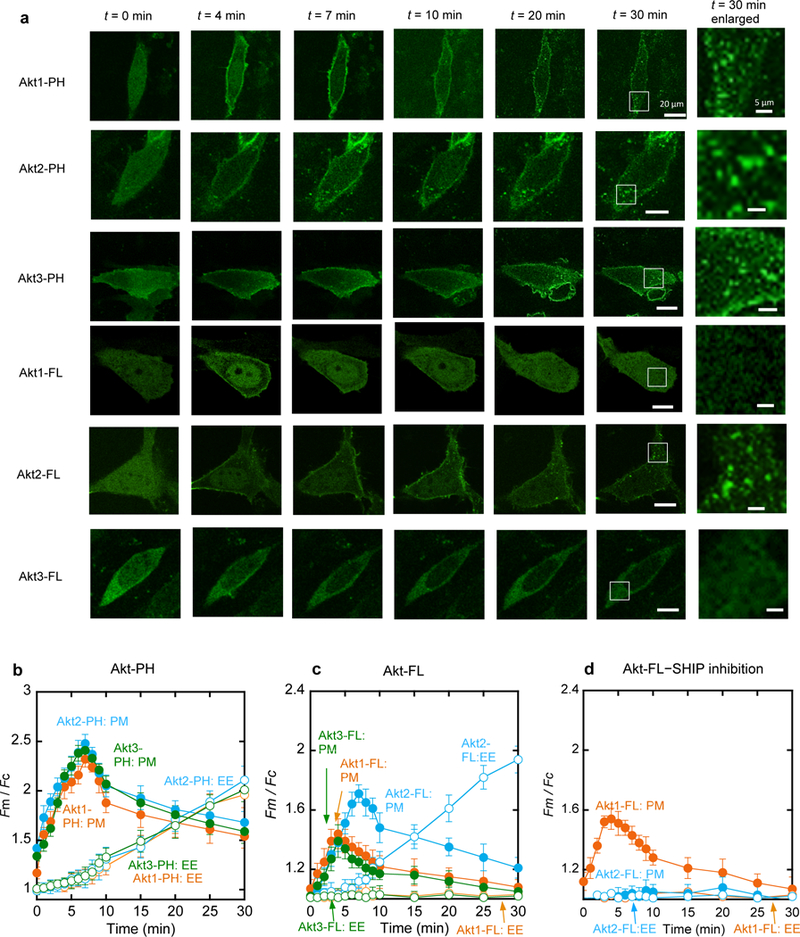
Figure 2.

Kinetics of membrane translocation of EGFP-tagged Akt isoforms and their PH domains in NIH 3T3 cells in response to PDGF-BB (50 ng/ml) stimulation. a. Representative fluorescence images of cells expressing Akt isoforms and their PH domains at a given time after PDGF stimulation. Images at 30 min are enlarged (white boxes indicate the enlarged regions) to demonstrate the localization of proteins at EE. Scale bars represent 20 µm for regular images and 5 µm for enlarged images. b. Quantification of the PM (filled symbols) and EE (open symbols) translocation of Akt1-PH (orange), Akt2-PH (blue), and Akt3-PH (green). c. Quantification of the PM (filled symbols) and EE (open symbols) translocation of Akt1-FL (orange), Akt2-FL (blue), and Akt3-FL (green) after PDGF stimulation. d. Effects of SHIP2 inhibition by AS1949490 (20 µM for 1 h) on the kinetics of the PM (filled symbols) and EE (open symbols) translocation of Akt1-FL (orange) and Akt2-FL (blue). Fm/Fc indicates the ratio of the average EGFP intensity at the PM to that in the cytosol. Each data represents the mean ± S.D. from three to five independent experiments (n = 42 cells for Akt1-PH, 35 for Akt2-PH, 35 for Akt3-PH, 45 for Akt1-FL, 38 for Akt2-FL, 31 for Akt3-FL, 28 for Akt1-FL with SHIP2 inhibition, and 29 for Akt2-FL with SHIP2 inhibition). Cells expressing similar levels of Akt proteins were selected for quantification. Scale bars indicate 20 µm.
