
Figure 1.
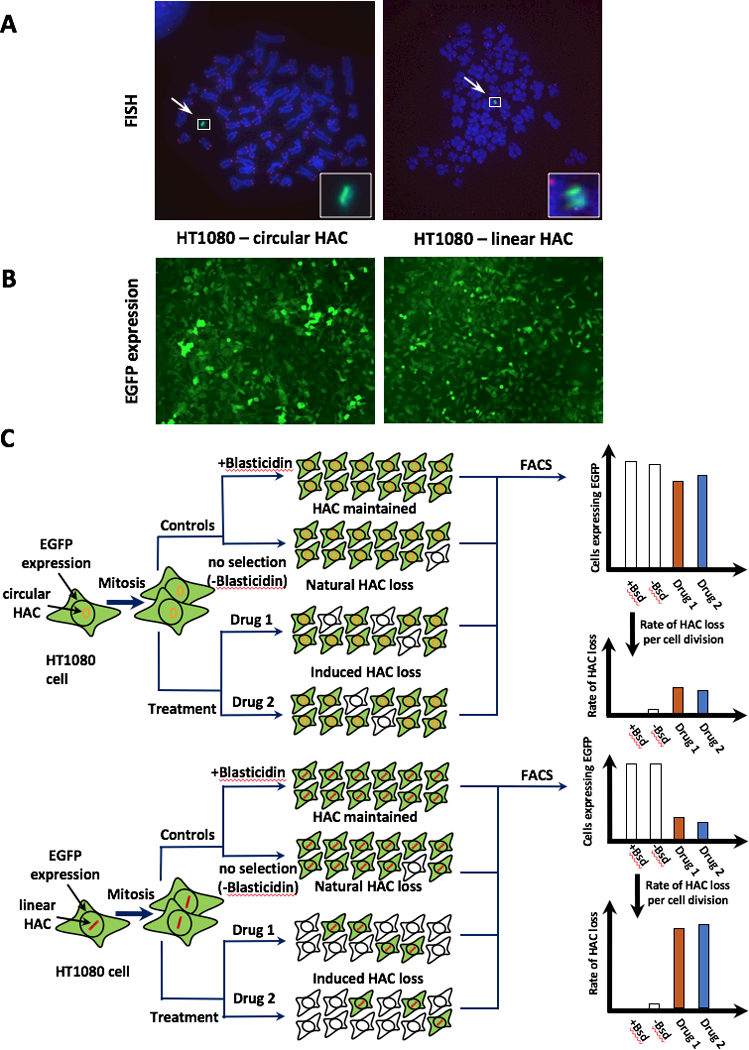
Scheme of an assay for measuring chromosome instability (CIN) based on the use of a linear HAC versus a circular HAC, both containing the EGFP transgene. A, FISH analysis of the HACs in HT1080 cells. The circular HAC was visualized using PNA probes for telomeres and for the vector part of the HAC as previously described (22,24). The linear HAC was visualized using the PNA probes designed in this work (see Materials and Methods for details). Chromosomal DNA was counterstained with DAPI. The HACs are indicated by arrowhead. B, Fluorescence images of cells carrying the EGFP-containing HACs. C, Scheme of an assay for measuring CIN based on the use of linear versus circular HACs, both containing the EGFP transgene. Cells that inherit any of these HACs display green fluorescence, while cells that lack them do not. Because both HACs are pretty stable during cell division, it is expected that the control cells should display uniform green fluorescence while there will be a mixture of EGFP positive and negative cells in the drug-treated population if the drug is specific to telomeres or telomerase (a linear HAC). The actual percentage of cells carrying EGFP-HAC can be measured by FACS as previously described (18).