
Figure 3.
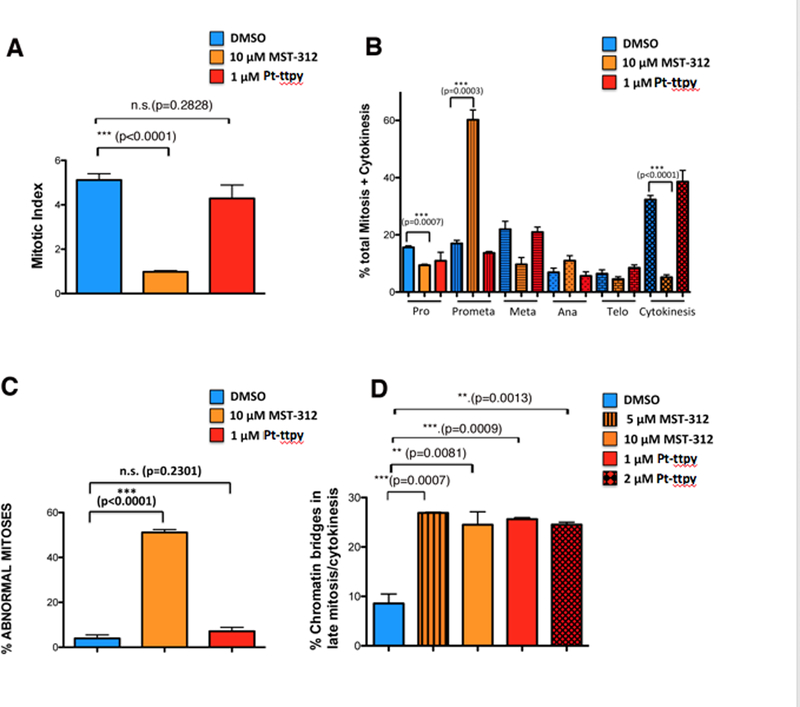
Quantification of defects in mitosis upon MST-312 and Pt-ttpy treatment of HT1080 cells. A, Mitotic index (a ratio between the number of cells in a population undergoing mitosis to the total number of cells) upon MST-312 or Pt-ttpy treatment. Three independent experiments were performed for each drug and more than 1,000 cells (n) were screened. B, Distribution of cells in different stages of mitosis upon MST-312 or Pt-ttpy treatment. Three independent experiments were performed for each drug and more than 100 mitotic cells (n) were screened. C, The percentage of cells exhibiting defects in mitosis upon MST-312 or Pt-ttpy treatment. D, The percentage of cells presenting chromatin bridges in late mitosis upon MST-312 (5 μM, 10 μM) or Pt-ttpy (1 μM, 2 μM) treatment, quantified using LAP2 as a marker. In all experiments bars compare results of untreated cells (DMSO) with drug-treated cells. Relevant results from statistical analysis (t tests) are shown; error bars correspond to SD; N.S.= not significant.