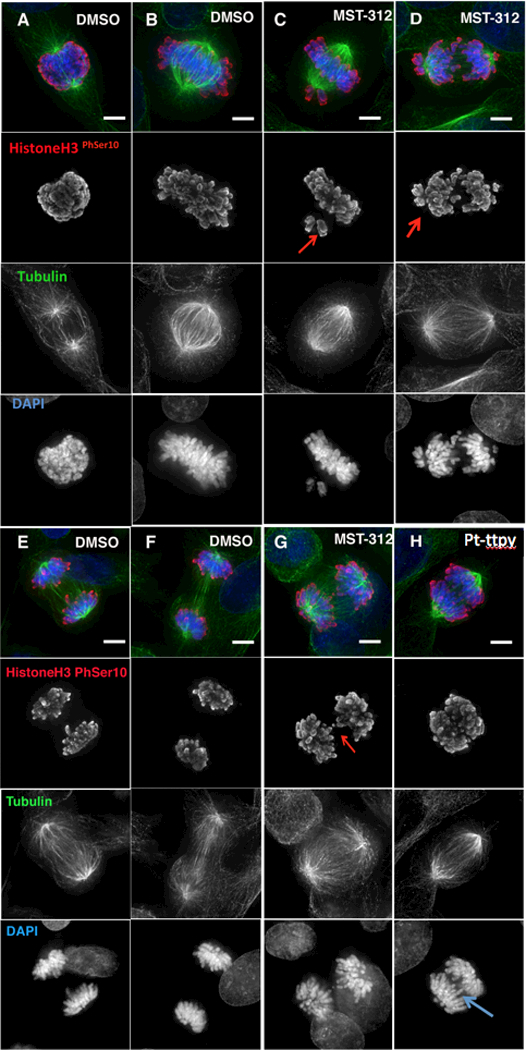
Figure 4.

Analysis of mitotic phenotypes induced by MST-312 and Pt-ttpy treatment of HT1080 cells. Cells in different stages of mitosis were stained with antibodies against phosphorylated HistoneH3 (Ser10) –a mitotic marker (in red) and α-tubulin (in green). A-B, and E-F, DMSO-treated control cells. C-D, MST-312-treated cells show chromosome alignment defects. Red arrows point at uncongressed chromosomes. G-H, Chromatin bridges appear in both MST-312- and Pt-ttpy-treated cells. Red/blue arrows point at chromatin bridges.
