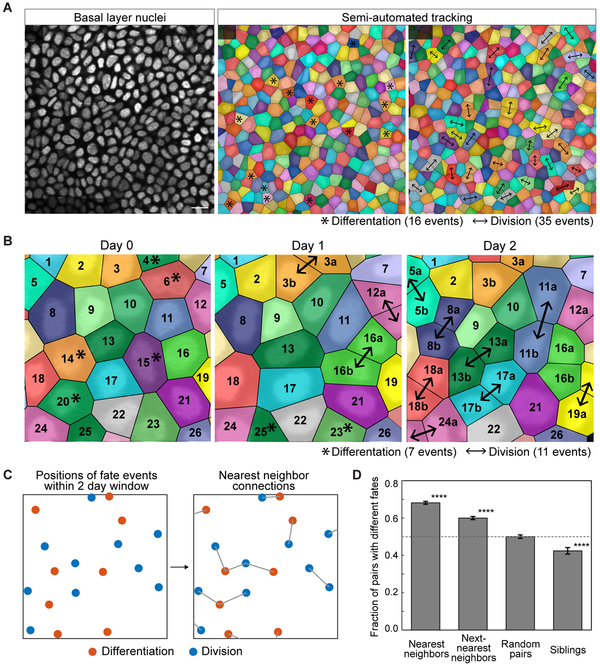
Figure 1. Basal fates are locally coordinated.
(A) Representative images showing the alignment, identification and tracking of individual basal cell behaviors over 12 hours. The regions of color represent the voronoi diagram calculated from the nuclear positions. Scale bar indicates 10 μm. Asterisks indicate that a cell will differentiate in the following 12 hours; arrows indicate that a cell has divided in the previous 12 hours.
(B) Representative tracking of basal cell fates over two days.
(C) Schematic of nearest neighbor fate analysis. Coordinates of the positions of divisions and differentiations were collected in 2 day time windows, and each of these positions were assigned a nearest neighbor fate decision point.
(D) Quantification of the fraction of pairs that execute opposite fates over a 2 day window when the pairs are nearest neighbors, next nearest neighbors, random pairs, or siblings. (**** represents p < 0.0001 obtained by a permutation test)

