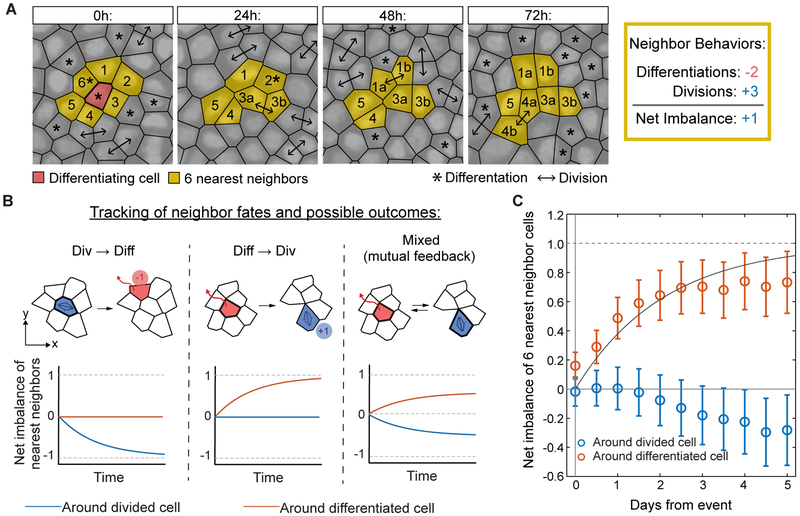
Figure 3. Stem cell self-renewal follows neighbor differentiation.
(A) Representative example of neighbor fate tracking following a differentiation event. The six cells in closest proximity to a differentiation event were followed to determine the imbalance in their fates over time. In this case, 2 direct neighbors differentiated (−2) and 3 neighbors divided (+3). We define difference between differentiation and division events, in this case +1 (1 more division than differentiation), as the “net imbalance”.
(B) Schematic of different possible neighbor fate imbalance scenarios. Depending on the temporal ordering of fates in neighboring cells, distinct patterns of imbalance surrounding divisions, differentiations or both are expected.
(C)Quantification of neighbor fate net imbalance corresponds to a model in which division follows differentiation within a short time scale. Data is from two 90 μm × 90 μm regions from one mouse; 524 divisions and 529 differentiations total. Solid line: , where τ = 1.8 days. Error bars represent s.e.m. See Figure S2F for analysis from two additional mice.

