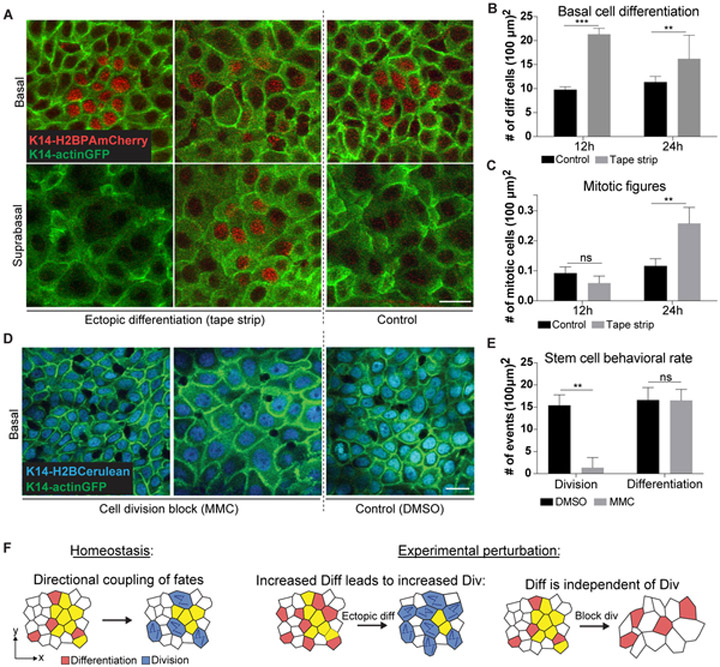
Figure 4. Differentiation is upstream and independent of self-renewal.

(A) Representative images of H2B-PAmCherry labeled basal and suprabasal cells after tape stripping to induce differentiation in mouse ear. Scale bar indicates 10 μm.
(B) Quantification of differentiation events by H2B-PAmCherry tracking after tape stripping in the mouse ear (n = 9 regions from 3 mice for each condition; error bars represent s.d.).
(C) Quantification of mitotic cells after tape stripping in the mouse ear. Mitotic events were scored based on cell morphology using K14-actinGFP signal (n = 9 regions from 3 mice for each condition; error bars represent s.d.).
(D) Representative images of basal cell density during Mitomycin C (MMC) induced cell division block in mouse ear. Scale bar indicates 10 μm.
(E) Quantification of basal cell division and differentiation events by PAGFP tracking after MMC treatment in the mouse ear (n = 9 regions from 3 mice for each condition; error bars represent s.d. See also Figure S3C).
(F) Schematic of directional fate coupling in homeostasis and after experimental perturbation.
