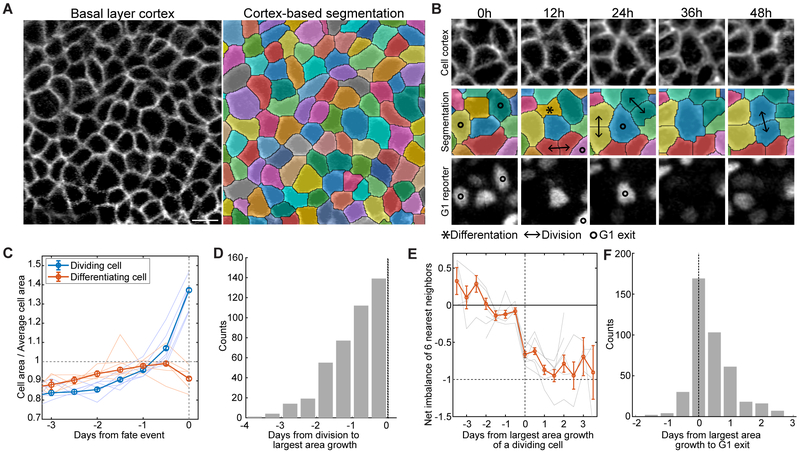
Figure 5. Cell enlargement precedes self-renewal.
(A) Representative images showing the segmentation of basal cells based on cortical K14-actinGFP signal. Scale bar indicates 10 μm.
(B) Representative example of an individual basal cell increasing in area concurrent with a neighbor differentiation, losing G1 reporter (mKO2-hCdt1(30/120)) signal, and dividing over the course of 48 hours.
(C) Quantification of average cell area prior to division and differentiation events. Thin lines correspond to 6 different regions from 5 mice (total of n = 1527 dividing cells and n = 1540 differentiating cells, error bars = s.e.m.).
(D) Histogram of the time elapsed between a cell’s period of largest area growth and its later division event (4 regions from 3 mice, n= 411 dividing cells).
(E) Quantification of fate imbalance in six nearest neighbors of dividing cells, expressed relative to the dividing cells’ period of largest area growth (6 regions from 5 mice, n = 1481 cells, error bars = s.e.m.).
(F) Histogram of the time elapsed between a cell’s period of largest area growth and its G1 exit (4 regions from 3 mice, n = 411 cells.).

