Figure 5.
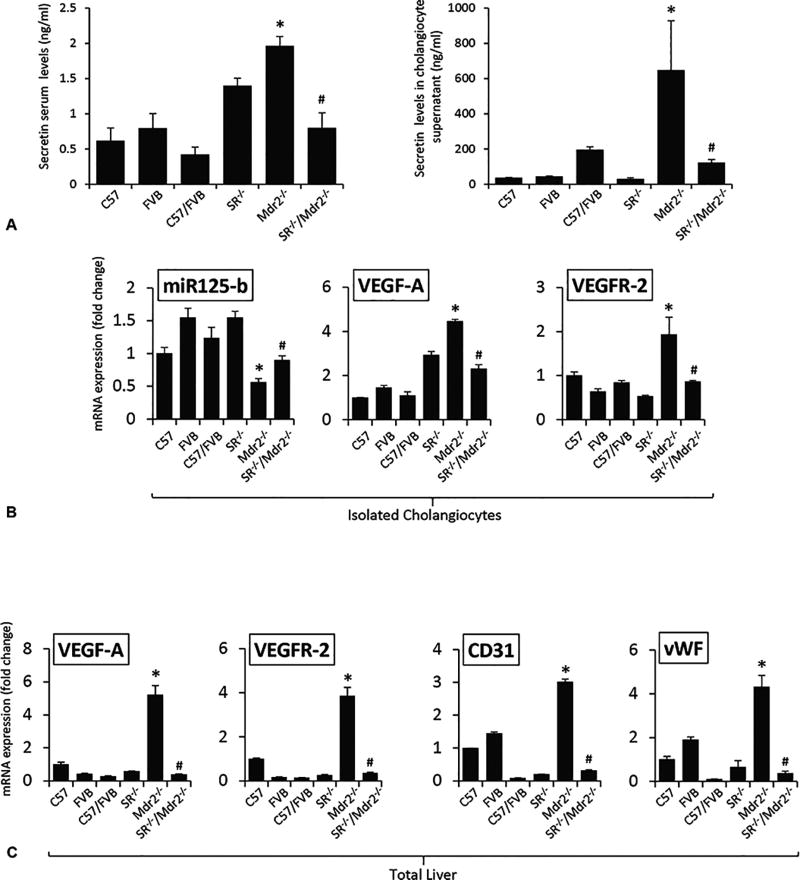
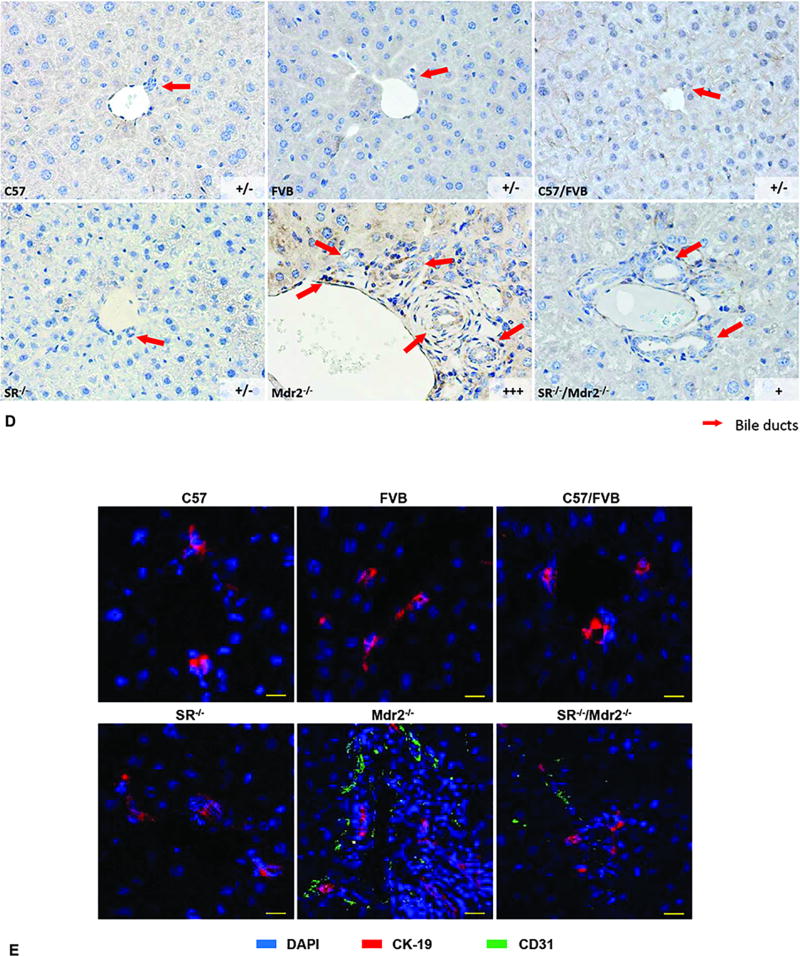
[A] Both Sct levels in serum and cholangiocyte supernatant were increased in Mdr2−/− mice compared to relative WT mice, which was decreased in SR−/−/Mdr2−/− mice compared to Mdr2−/− mice. *p<0.05 vs. FVB mice; #p<0.05 vs. Mdr2−/− mice. Data are mean ± SEM of n=3 from 9 mice. [B–C] There was enhanced expression microRNA 125b in cholangiocytes, VEGF-A and VEGFR-2 in both cholangiocytes and total liver, as well as CD31 and vWF in total liver from Mdr2−/− mice compared to the corresponding WT mice, expression that returned to values similar to that of normal WT group in SR−/−/Mdr2−/− mice. Data are mean ± SEM of n=3 from one cumulative preparation of cholangiocytes from 8 mice, and 3 total liver samples from 3 mice. *p<0.05 vs. FVB mice; #p<0.05 vs. Mdr2−/− mice. [D] There was enhanced immunoreactivity for VEGF-A in liver sections from Mdr2−/− mice compared to relative WT mice, which was reduced in SR−/−/Mdr2−/− mice compared to Mdr2−/− mice; orig. magn., ×40. [E] There was enhanced immunoreactivity for CD-31 (green color, costained with CK-19 in red) in liver sections from Mdr2−/− mice compared to relative WT mice, which was reduced in SR−/−/Mdr2−/− mice compared to Mdr2−/− mice; Scale bar = 100 µm.


