
Figure 2:
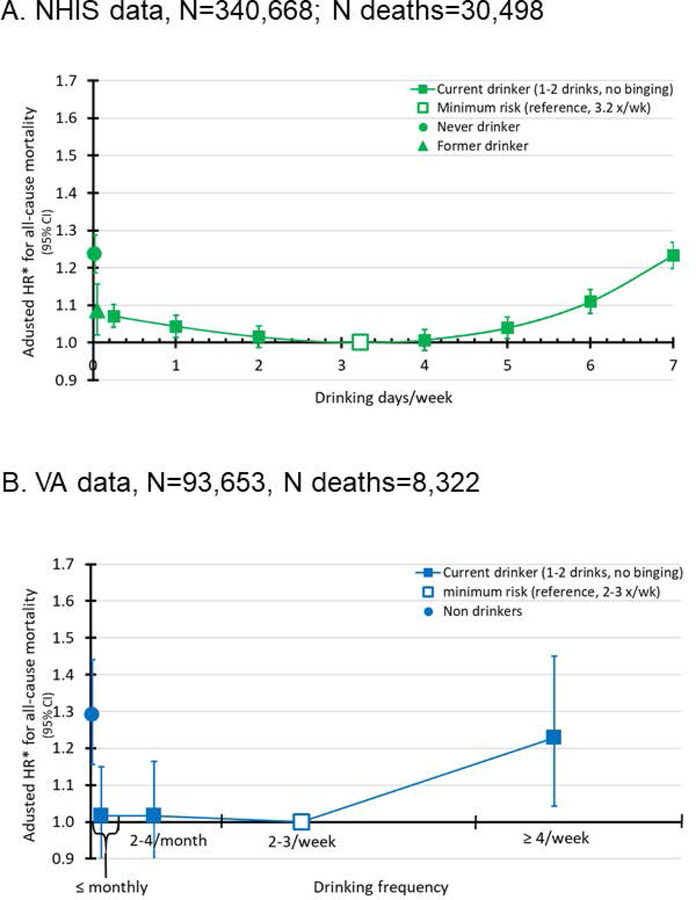
Adjusted hazard ratios* of all-cause mortality by drinking frequency for individuals who drink 1–2 drinks on occasion and never binge drink.
2A. NHIS data, N=340,668; N deaths=30,498
*NHIS hazard ratios are adjusted for birth cohort, gender, race, typical drinking quantity when not binge drinking, frequency of binge drinking, health and wellness factors (current smoking status, perceived health status, exercise level, and medical comorbidities), socioeconomic factors (educational attainment, employment status, and whether the household received food stamps in the last calendar year), region of country, and year of survey.
2B. VA data, N=93,653; N deaths=8,322
*VA hazard ratios are adjusted for birth cohort, gender, race, typical drinking quantity when not binge drinking, frequency of binge drinking, and medical comorbidities.