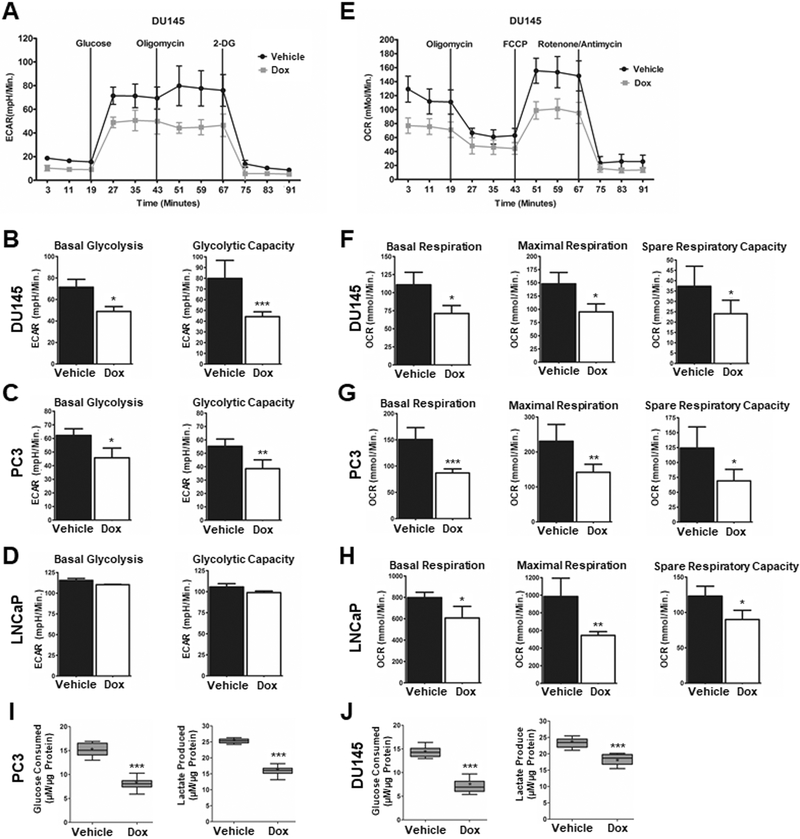
Figure 4: CD38 reduces glycolytic and mitochondrial capacity.
A, Representative trace of a glycolytic stress test in DU145 cells following treatment with doxycycline (1μg/ml) for 96Hrs to induce CD38 (N = 3). B-D, Quantification of basal glycolysis and glycolytic capacity in DU145, PC3, and LNCaP cells treated with doxycycline (1μg/ml) for 96Hrs (N = 3). E, Representative trace of a mitochondrial stress test in DU145 cells following treatment with doxycycline (1μg/ml) for 96Hrs (N = 3). F-H, Quantification of basal respiration, maximal respiration, and spare respiratory capacity in DU145, PC3, and LNCaP cells treated with vehicle (dH2O) or doxycycline (1μg/ml) for 96Hrs (N = 3). I-J, Quantification of glucose consumed or lactate produced in PC3 and DU145 cells following 96Hr treatment with doxycycline (1μg/ml) (N=6). (*p ≤ 0.05, **p ≤ 0.01, ***p ≤ 0.001)

