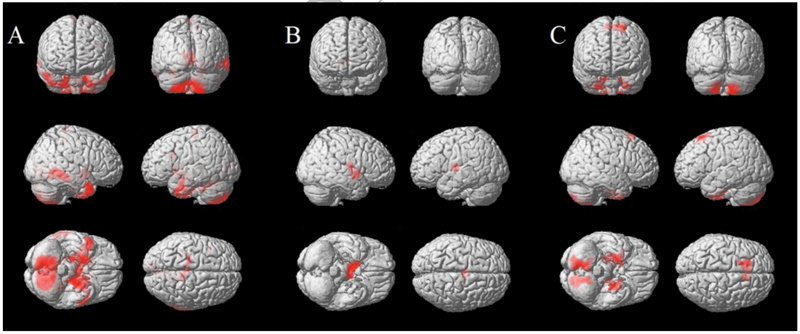
Figure 2.
Results of the Voxel Based Morphometry analysis showing significant differences between groups. Areas of relative GM reduction in African American MS patients compared to controls (A), Caucasian MS patients compared to controls (B) and African American compared to Caucasian patients (C) are showed in red, overlaid on the 3D brain surface rendering of a single normal subject provided in SPM12 (p<0.01, FWE-corrected at cluster level).

