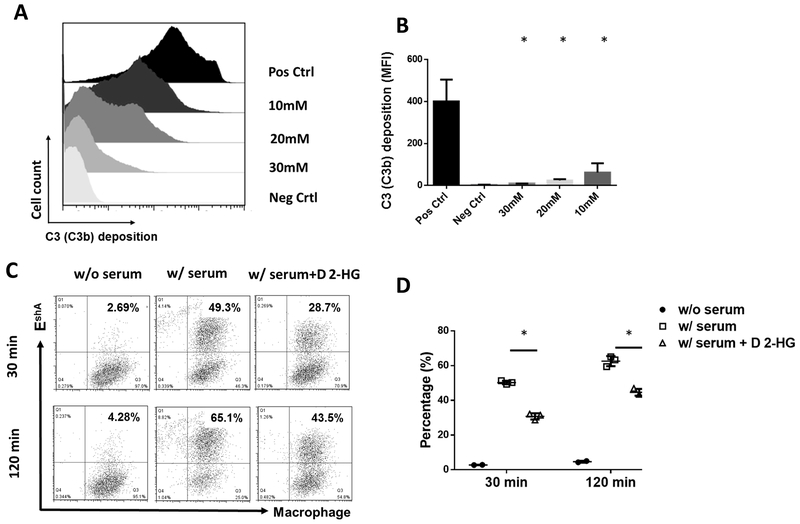
Figure 3. D 2-HG reduces complement opsonization–induced phagocytosis and complement-mediated glioma cell line damage.
A, representative flow cytometric histogram of C3b(i3Cb) deposition on the EshA cell surface in the presence of different concentrations of D 2-HG. For complement opsonization assays, EshA were incubated with 2% C5-depleted serum in the presence of the stated concentration of D 2-HG before C3b(iC3b) deposited on the cell surface was quantitated by flow cytometry. B, summarized results of the levels of C3b/i3Cb deposition on the cell surface in the presence of defined concentrations of D 2-HG as measured by mean fluorescence intensity (MFI). Pos Ctrl, positive control, cells were incubated with serum in the absence of D 2-HG; Neg Ctrl, negative control, cells were incubated with serum in the presence of EDTA (to completely inhibit complement activation), data are mean ± SD and analyzed by one-way ANOVA. * p<0.05. C, representative results of D 2-HG on phagocytosis. For complement-mediated phagocytosis assays, macrophages were prepared and labeled with CellTrace far-red fluorophore, while EshA were incubated with or without 2% C5-depleted serum in the absence or presence of 30 mM D 2-HG (for complement opsonization) and labeled with fluorescent DiI. Then the processed macrophages and EshA were co-cultured at a 1:10 ratio, and after either 30 or 120 min incubation the cells were analyzed by flow cytometry to measure the efficiency of phagocytosis (frequency of double-positive cells). w/o serum, EshA were incubated without serum (no opsonization, negative control), w/serum, EshA were incubated with serum in the absence of D 2-HG (maximum opsonization, positive control), w/serum+ D 2-HG, EshA were incubated with serum in the presence of 30 mM D 2-HG. D, summarized results of phagocytosis assays. Data are mean ± SD and analyzed by student t test. * p<0.05

