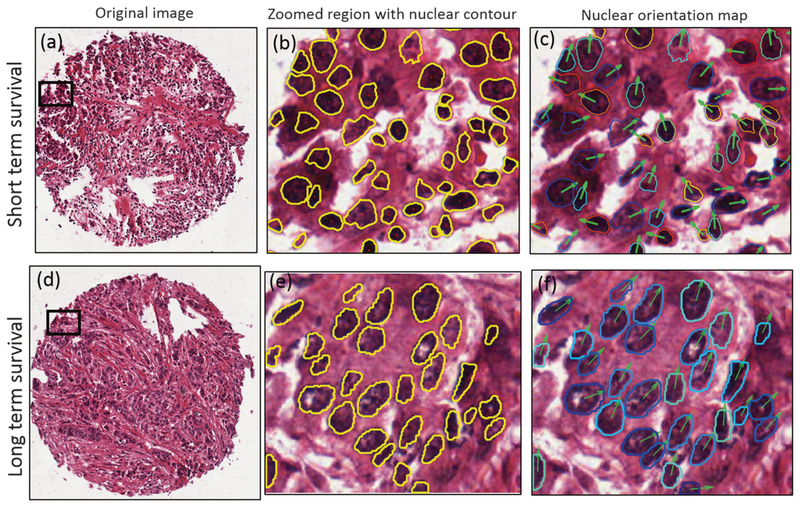
Fig. 4.
Representative H&E-stained TMA spot images for a short-term survival and d long-term survival patient. b, e Zoomed region with pre-segmented nuclear contour, from which the nuclear shape and orientation measurement are extracted. c, f The nuclear orientation map, in which the nuclear contours with different colors indicate different nuclear orientations; the nuclear orientation is also demonstrated by arrows. The long-term survival patient, shown in f, tends to have uniform distribution of nuclear shape (similar in nuclear shape/size in e than that in b) and nuclear orientation (similar colors/orientation in f than that in c), compared to that of short-term survival patient

