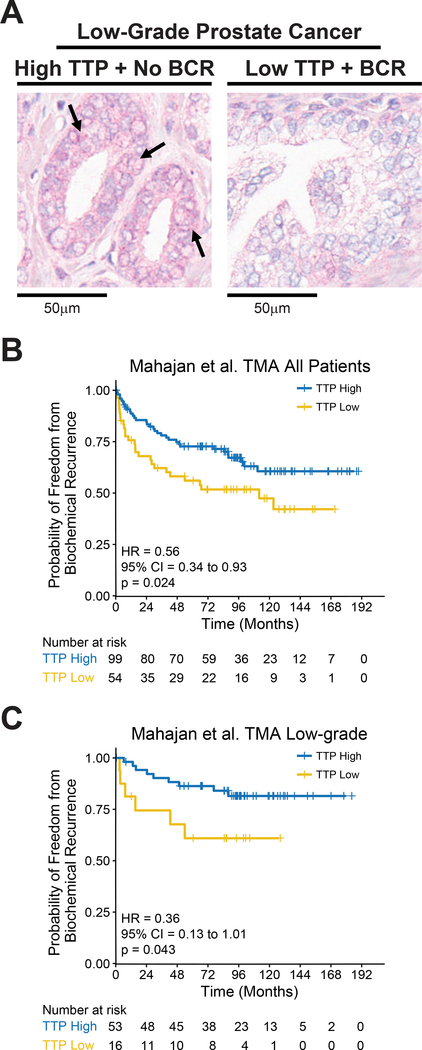
Figure 2.
TTP protein levels predict risk for progression to BCR. A, Representative images (20x magnification) of TTP immunohistochemistry (IHC) showing TTP protein expression in low-grade primary prostate tumors collected at prostatectomy that remained indolent (No BCR) or developed BCR. Arrows indicate cells with high TTP protein levels (pink). B, Kaplan-Meier curves showing the time to BCR in primary prostate cancer patients from the Mahajan et al. TMA cohort separated into TTP-High and TTP-Low subtypes based on composite TTP IHC scoring for all patients (B) and low-grade patients (C) (p-values, Mantel-Cox log-rank test).

